Industrial and agricultural ammonia point sources exposed
Lieven Clarisse and Martin Van Damme from ULB have reported on their findings in Nature this week and they are reproduced below on our Science Blog.


The Atmospheric Spectroscopy Group at the Université Libre de Bruxelles (ULB) have been using the Infrared Atmospheric Sounding Interferometer (IASI) onboard Metop satellites to identify global ammonia hotspots, and they have kindly shared their findings with us.
12 March 2021
06 December 2018
For over 10 years, the IASI instrument on board the three successive Metop satellites have been providing scientists with global data on various atmospheric components, including ammonia.
"Because of its role in the formation of particulate matter, atmospheric ammonia is a key driver of air quality, with major impacts on human health and life expectancy. Excess ammonia also affects the entire biosphere through acidification and eutrophication of ecosystems and, indirectly, the climate."

"Anthropogenic NH3 emissions originate mainly from agricultural, domestic and industrial activities, but both the total budget and the partitioning between the sources are highly uncertain, on all spatial scales."

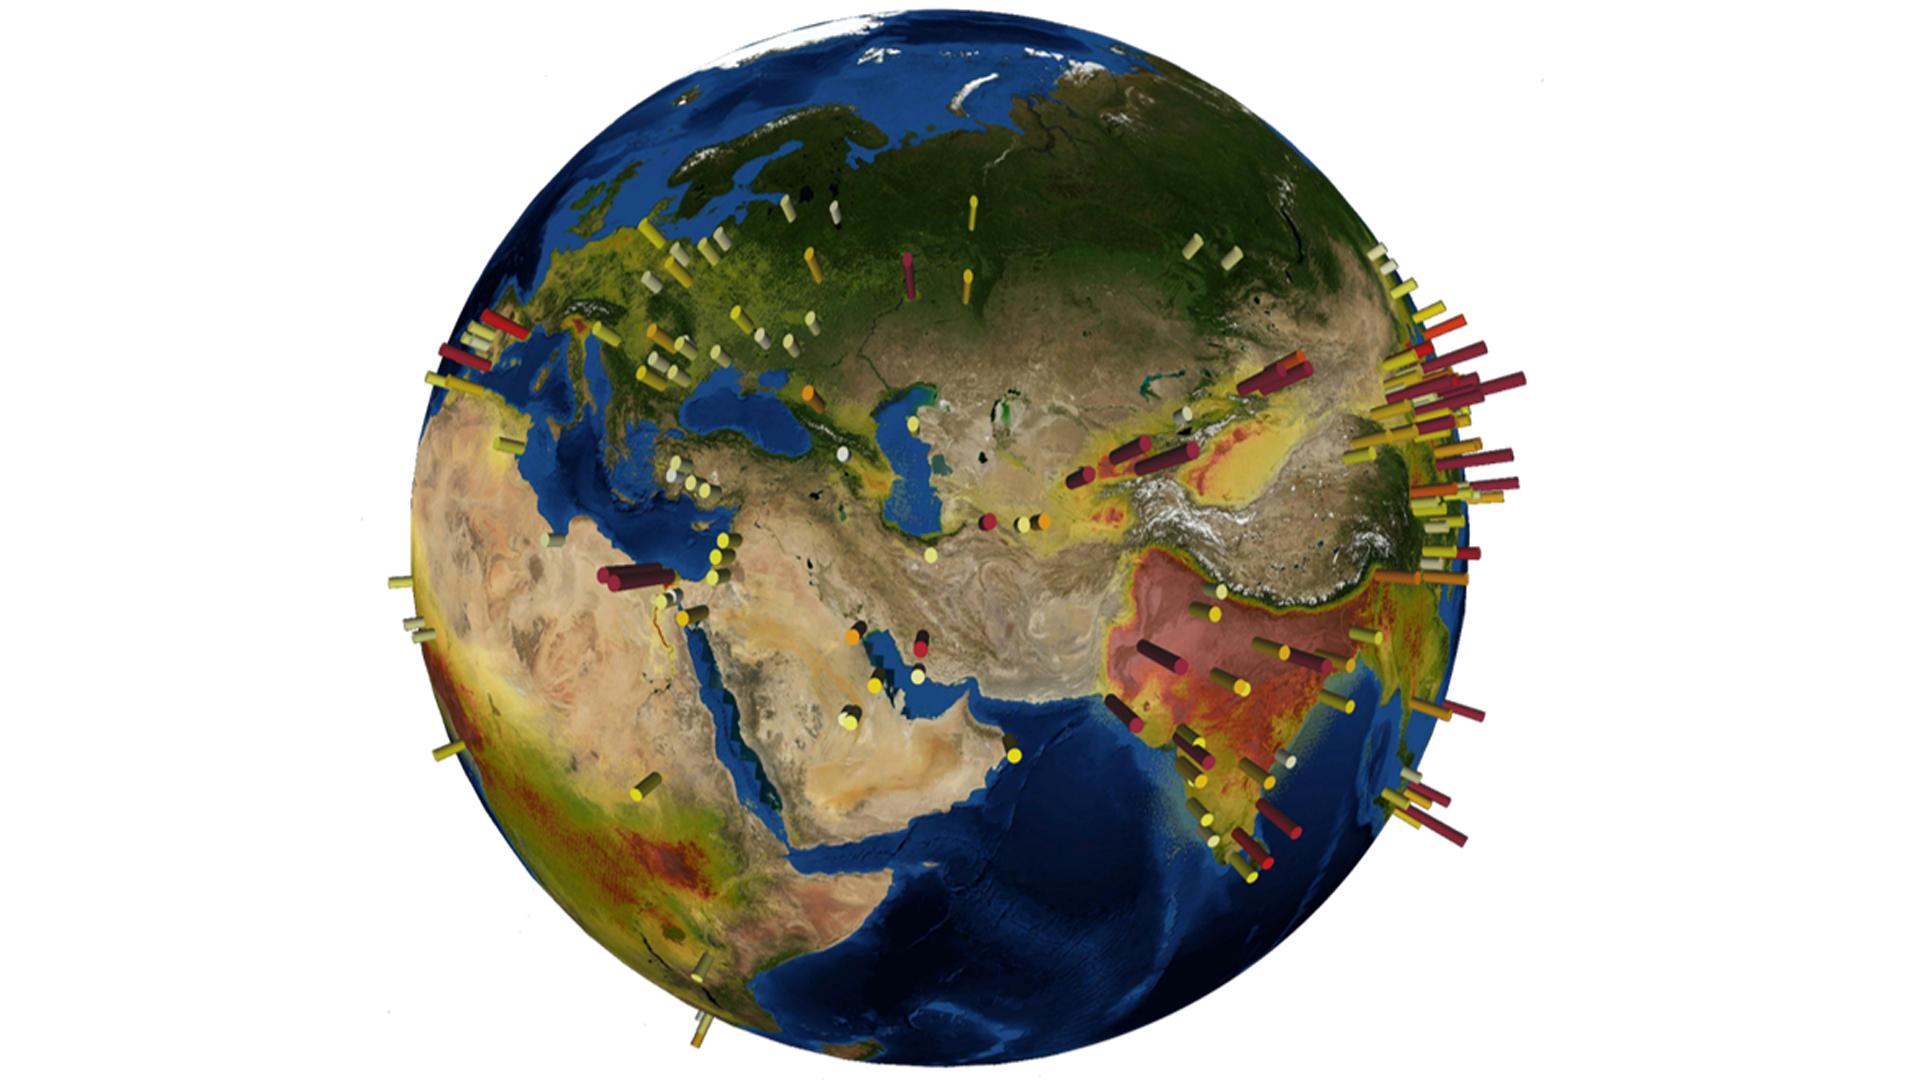
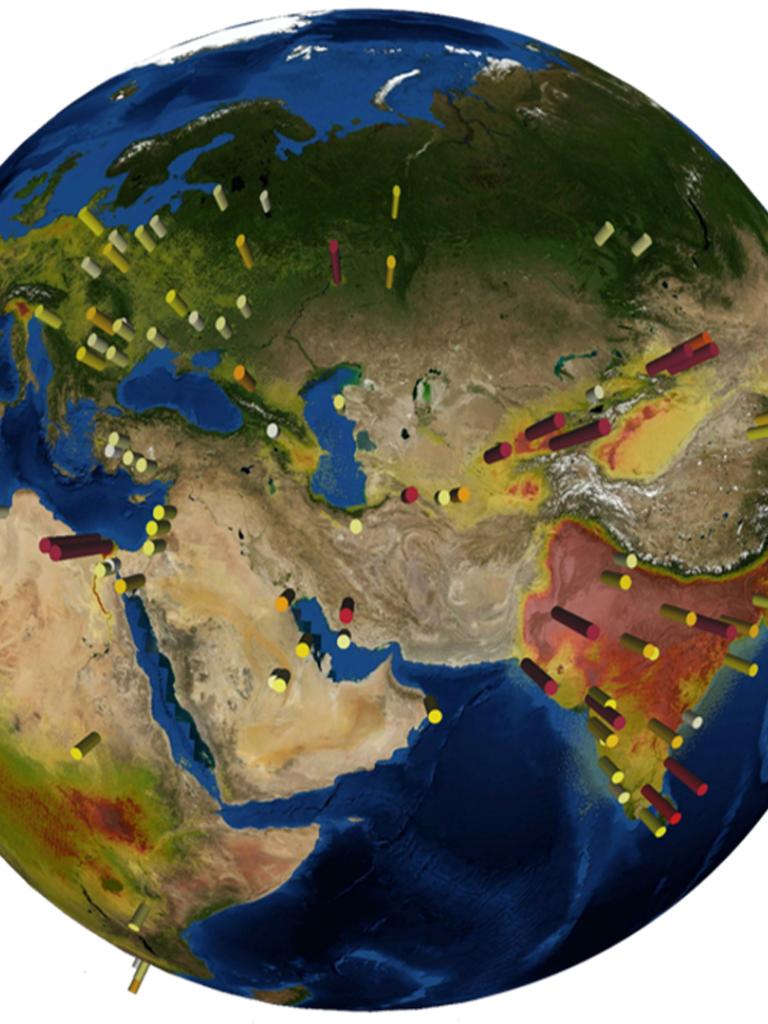
Using almost a decade of IASI measurements, researchers from ULB have generated a high-resolution map (~1km²) of the global atmospheric distribution of ammonia. From it, they identify, categorise and quantify over 200 hotspots that could be traced back to either a single or a cluster of agricultural and industrial point sources. One natural hotspot was also determined.

This research has shown that emissions from such sources were drastically underestimated in the current bottom-up inventories, with 2/3 of the identified point sources completely absent.

"The IASI era (2007+) also allows for observing changes in human activities. Opening and closures of industrial sites were identified in Eastern Europe and China, as well as agriculture in transition in South America.
These findings suggest the need to completely revisit the emission inventories for anthropogenic NH3 sources, and to account for their rapid evolution in time. This is critically needed for assessing the health and environmental impact of NH3 and implementing suitable nitrogen management strategies."

Federico Fierli, Senior Trainer within the User Support and Climate Service Division at EUMETSAT had this to add:
"Measuring NH3 through satellite observations is a very important achievement, especially as the NH3 produced by agriculture and farming is highly volatile and difficult to measure. There are in-situ networks available, however these do not provide global coverage and measurements are achieved using different techniques.
NH3 has an acidification effect on soil and water and is therefore considered harmful. There are some agreements in place to control and reduce these emissions with abatement techniques, and the use of satellites provide a unique time and spatial coverage that makes it possible to control the effect of the emission abatement strategy.
Observing the atmosphere with the IASI instruments on board the polar-orbiting Metop satellites, is a strategy employed by EUMETSAT that will allow for the long-term monitoring of NH3."
Read the full article here.
Reference: Van Damme, M., Clarisse, L., Whitburn, S., Hadji-Lazaro, J., Hurtmans, D., Clerbaux, C., Coheur, P.-F. Industrial and agricultural ammonia point sources exposed. Nature, (2018).