On the trail of dust
Sophie Vandenbussche turns Metop observations into real-time and long-term insights into atmospheric particles and pollution


Key points:
- Sophie Vandenbussche develops mathematical approaches to extract data relevant for tracking dust and greenhouse gases from measurements made by Metop’s Infrared Atmospheric Sounding Interferometer (IASI)
- IASI datasets are used to study long-term trends in dust and other pollutants
- Data are not yet fully integrated into forecast models, however they hold significant potential to improve their accuracy, Vandenbussche says
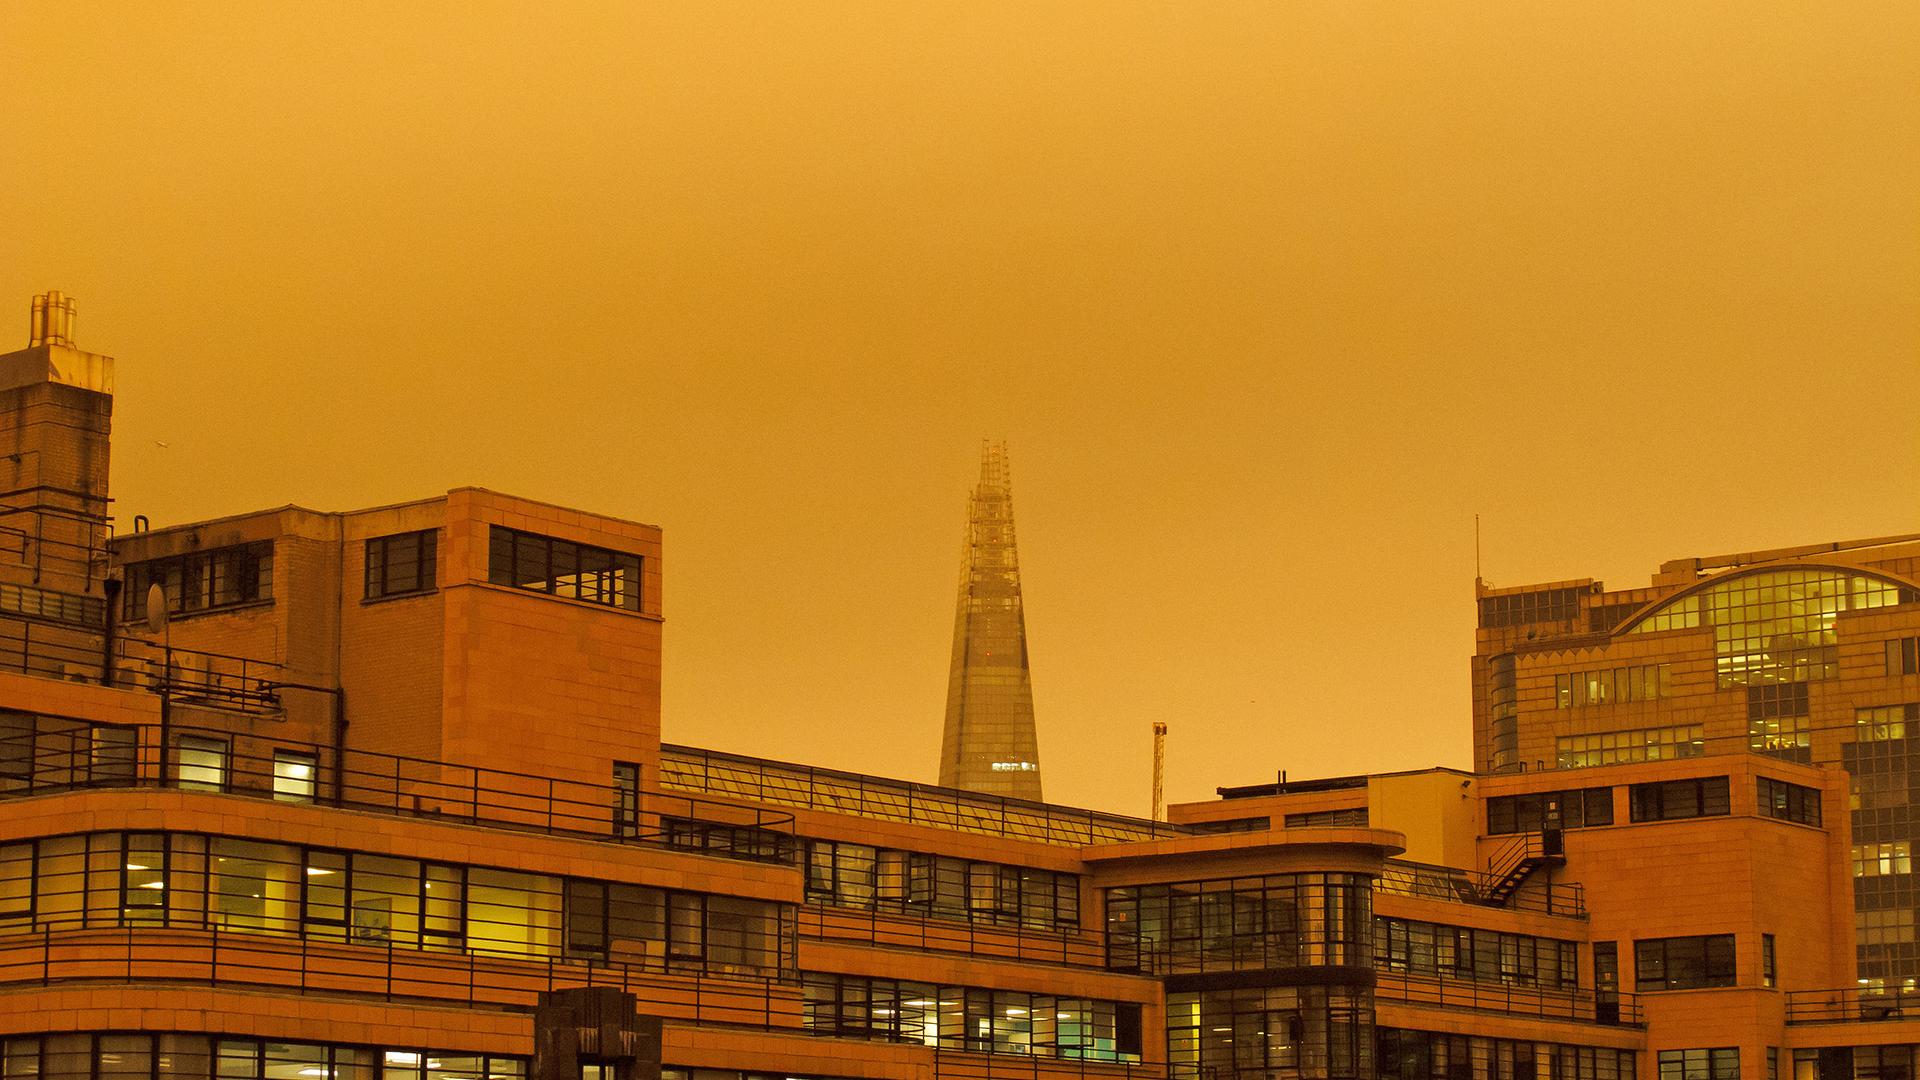
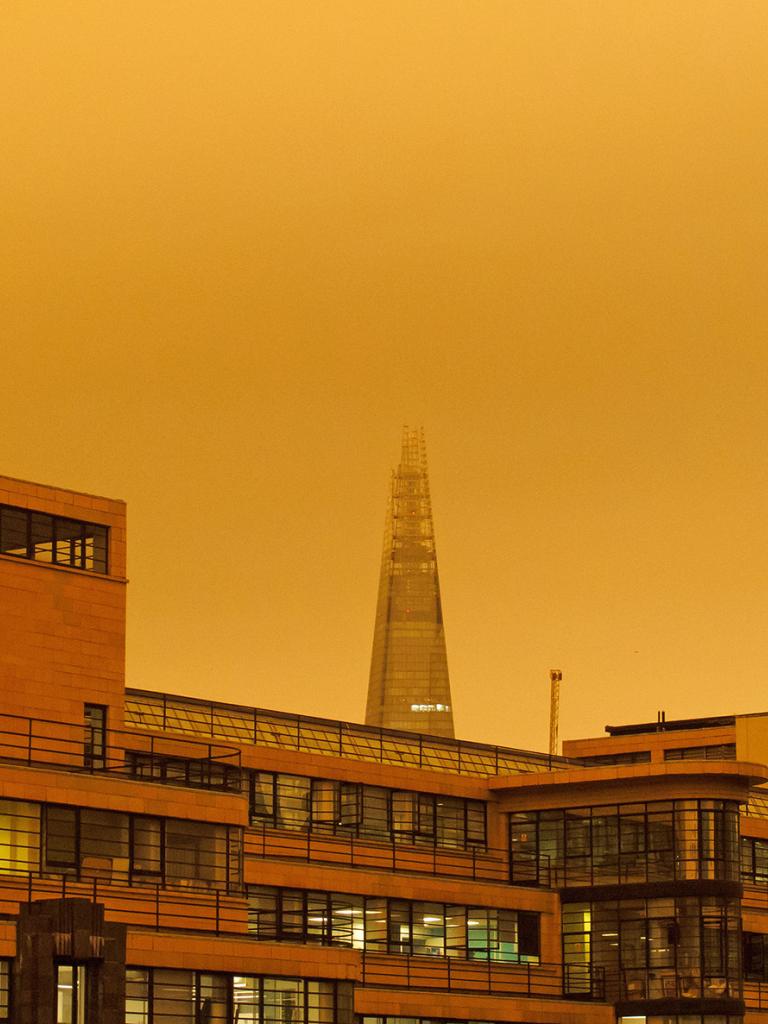
On 16-17 October 2017, striking red and yellow skies were seen across Northern Europe, from the beaches of Brittany to the streets of Brussels.

Aerosols in the Earth’s atmosphere can scatter and absorb shorter-wavelength blue light, letting more red light pass through and creating the eery-looking skies
Credit: Gunnar Ries CC-BY-2.0
Debuting in 2006, IASI was originally intended to provide three-dimensional temperature and humidity observations, data that have substantially improved medium-range weather forecasts in Europe.
However, the wavelengths that IASI operates in also presents opportunities to study and monitor the atmosphere’s chemistry. Here, advancements are often driven by researchers like Vandenbussche, who develop mathematical approaches to extract relevant data from the instrument’s radiance measurements.
“While IASI dust data aren’t yet fully integrated into forecast models, they hold significant potential to improve their accuracy,” Vandenbussche says.
“Large variations in the composition, size and concentration of dust particles make measuring and quantifying them very challenging. There’s a lot of research underway to test how these data could be applied in real-world scenarios, especially in cases where dust plays a critical role in atmospheric processes.
“For example, by combining IASI observations with lidar (light detection and ranging) data and forecast model outputs, scientists were able to analyse the Ophelia event step by step, mapping atmospheric dust, as well as carbon monoxide and ammonia from the wildfires.

Credit: Lieven Clarisse, ULB
“This helped to unravel a complex picture, with different layers of aerosols passing overhead at different times, linked to the movement of various air masses associated with the storm. Having these data is important because dust and smoke particles can harm human health, disrupt transport and affect solar energy production. Moreover, if they are not fully accounted for in numerical weather prediction models it can make those forecasts wrong in some cases.”
A multitude of data
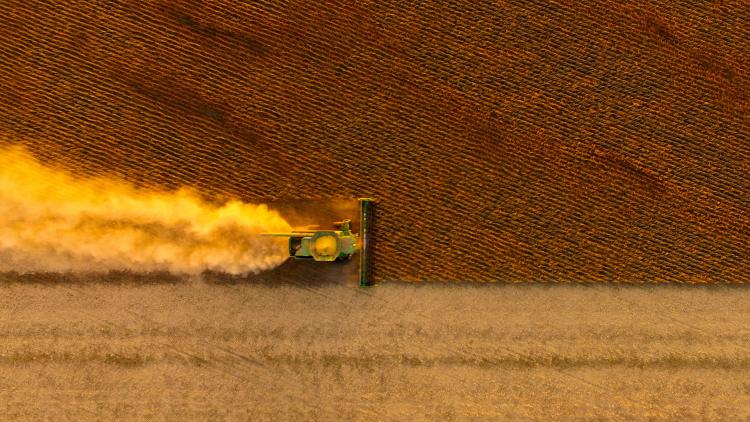
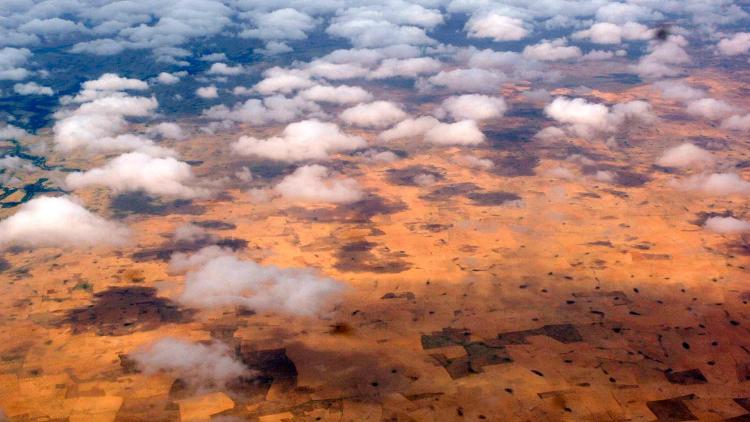
Major dust plumes are propelled over Europe around 10 times a year on average. Recent years have seen large clouds of Saharan dust over the Canary Islands and the Alps, record peak concentrations over Southern Spain, and the largest dust plume ever recorded, over the Caribbean.
This has raised concerns about the potential impacts of climate change on the frequency and intensity of dust storms.

Credit: CAMS/ECMWF
“This is an area with many unanswered questions,” says Vandenbussche. “When studying trends, you need a lot of data, and with nearly two decades of continuous observations, IASI offers an invaluable resource for addressing them.
“Two main factors drive long distance dust transport: the availability of light, dry mineral sediment sources and wind conditions that lift particulate matter high into the troposphere. However, the dynamics can vary wildly. In some regions, the risk of dust storms is highest after sunrise, when the sun’s heat creates strong surface winds. In other areas, the risks peak in the afternoon, when cold air downdrafts from mountain areas tend to intensify.
“One of the unique strengths of IASI is the radiance data enables scientists to determine the altitude of a dust plume, as well as aspects such as the size and quantities of particles, all of which can affect the hazardousness of events.
“By aggregating data over months and years, scientists can deepen their analysis of dust sources in specific locations and better understand patterns. By combining these observations with other satellite data – such as wind speed data and surface characteristics like soil moisture and vegetation, we can better understand seasonal shifts, diurnal cycles, and long-term trends.”

Credit: EUMETSAT/CNES
New Generation
The upcoming launch of Metop Second Generation – A satellite, which will host the IASI – New Generation (IASI-NG) instrument, is set to continue observations for at least two more decades while also delivering higher-resolution data.
“One ultimate goal is to integrate IASI-NG data into air quality forecasts, where it could be invaluable for predicting the movement of atmospheric dust and pollutants,” says Vandenbussche.
“Improving near-real-time capabilities could help fulfil many of the requests we receive from data users, such as aviation specialists, health experts, and weather forecasters.
“Each method meteorologists use to observe dust has strengths and limitations. Instruments like IASI, in low-Earth orbit, provide high-spectral-resolution data. These data are complemented by instruments on Metop and other polar-orbiting satellites that provide data in the visible spectrum. Combining the different spectral ranges enables us to benefit from the different sensitivity – to measure particle size, composition, and altitude – in those different spectral ranges and ultimately identify and quantify sand and dust storms more precisely.
“Instruments on geostationary satellites, by contrast, collect data several times an hour, providing a tremendous geographic coverage, but at a lower spectral resolution. Ground-based instruments add another layer, offering detailed profiles of the atmosphere up to the upper troposphere, though their range is limited to specific locations.
“Together, these observations can provide both the localised detail and the sweeping global perspective that can help us to see the bigger picture.”
Vandenbuscche adds she is also excited about the opportunities IASI-NG presents not just for dust observations but for monitoring greenhouse gases like nitrous oxide, which is a focus of other projects her team is working on.

Credit: EUMETSAT/CNES
“The most exciting part of this work is that we’re constantly improving, innovating, and inventing – there’s always something new,” she says.
“Meteorology relies heavily on teamwork and the interactions I have with the community – through workshops, annual conferences like the EUMETSAT and IASI events, and collaborations with instrument developers, physicists, and specialists who reprocess datasets to ensure long-term quality and consistency – are tremendous.
“They inspire new ideas, deliver productive feedback, and help ensure that our methods meet the needs of a wide range of end users, who are always our central motivation.”
Author:
Adam Gristwood
Main Image Credit:
Roger Jones, CC-BY-2.0


