Getting to know the weather a little better with the Polarstern
It’s week four of the Polarstern’s voyage and you know what that means – a brand-new blog post from the students following its path.

This time, the new group dive into the "Intertropical Convergence Zone"... not sure what that is? Read on to find out!
09 August 2021
10 December 2018
Blog four
Weather phenomena around the equator
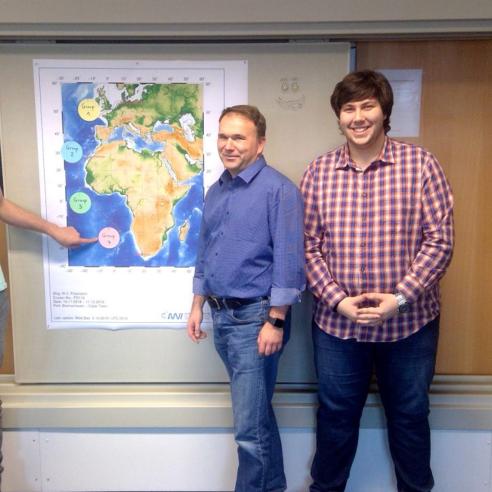
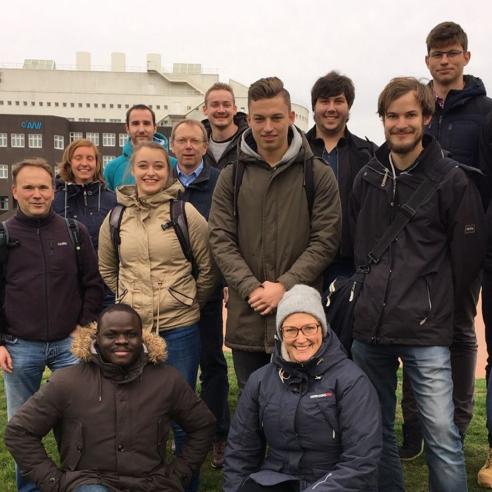
Authors: Sabine Schmidt, Laura Janßen, Thomas Möslang

After passing the trade winds, the Polarstern has now made its way to the Intertropical Convergence Zone (ITCZ). In terms of weather, this zone (located near the equator) is an interesting spot where the north- and south-easterly trade winds converge.
The area is referred to by sailors as the "doldrums" (maybe you remember this term from the film Finding Nemo?) or "calms". The name comes from the lower, or rather, "calmer" winds present in this area. Across a 100 kilometre-wide streak lies a belt of low pressure, affected by the high Sun near the equator. This belt moves across the globe at a near zero-degree latitude. It is known as the "near-equatorial through".

What affects this area of low pressure and what weather phenomena are typical there?
Driven by solar energy, the trade winds draw the air in. Then, from where the water temperature is at its maximum we find the highest long-wave radiation and consequently, the air heats up and rises. While rising, the air cools down adiabatically and when it reaches the dew point, condensation begins and clouds form.
Then on the ground where the trade winds converge, a thermal low develops. Affected by the high humidity, tall, dense clouds like the cumulonimbus form. Via satellite, the ITCZ is visible by these distinctive and typical cloud formations.
As already mentioned, due to the high humidity there is a strong, high-reaching convection, which is the perfect condition for massive thunderstorms to develop. This is very typical weather in the ITCZ: daily thunderstorms accompanied with showers and strong gusts of wind from different directions. Therefore, the region of the doldrums is frequently active.
We considered which composites of satellite data would be helpful in observing the weather around the ITCZ and decided on the Severe Storms RGB and Natural Colour RGB. For a better understanding of both, here's a brief overview of them.
The Natural Colour RGB is designed to distinguish the various surface structures of the Earth for the user and, as the name suggests, represent it in realistic shades.
To achieve a good representation of the Earth’s surface when viewed from outer space, the three basic colours: red, green and blue (hence the name RGB in the title) were assigned two channels, one with a visible wavelength and one with a wavelength visible from a near-infrared range.
The colour red was assigned to the channel NIR (near-infrared) 1.6. The figure 1.6 indicates a wavelength of 1.6 μm (microns). Within this range, ice clouds have a much lower reflectivity than water clouds. A low proportion of red in the satellite image is therefore a feature of ice clouds, but also of ice-covered landscapes and sea ice. A higher proportion of red is a feature of water clouds.
It is no coincidence that green was assigned the channel VIS (visible) 0.8. If you want to be precise, you will see below that the spectral range of the channel 0.74-0.88 µm and the upper border of the visible light is 0.78 µm. You can see that only a small range of this channel is within the range of visible light. The special feature of this channel is to make vegetation recognisable. Plants reflect this wavelength with a strong value, so photosynthesis doesn't take place in this wavelength range. As a result, a high proportion of green is a characteristic of pronounced vegetation.

Source: EUMeTrain. Training module for RGB’s
The colour blue was assigned the channel VIS 0.6. The value of 0.6 corresponds to the expected wavelength of 0.6 μm. Within this wavelength range, plants absorb a lot of sunlight and so photosynthesis is therefore very active.
A minimal blue value is a sign of vegetation on the Earth’s surface. The combination of these three channels leads to the characteristic appearance of the Natural Colour RGB.
In the Natural Colour RGB composite image below, high reaching, cold clouds like frontal or cumulonimbus clouds as well as thin, cirrus clouds appear as the colour cyan. The ITCZ area displays the clouds with ice crystals very clearly at the top (arrow). It is not possible to see the centre of cumulonimbus clouds during heavy thunderstorms.

In contrast, the Severe Storms RGB composite (seen below) clearly differs in its presentation from the Natural Colour RGB. The channels are primarily used to display, detect and better interpret high-reaching convection clouds.
Similarly to the Natural Colour RGB, the three basic colours red, green and blue have been assigned to corresponding channels. The channels WV6.2 and WV7.3 are displayed in red. WV (water vapour) covers the wavelengths 6.2 μm and 7.3 μm. The colour green has been assigned channels IR3.9 and IR10.8. IR (infrared) covers 3.9 μm and 10.8 μm respectively. The blue colour value indicates the channels NIR1.6 and VIS0.6 - we've already seen these two single channels used on the Natural Colour RGB composite.
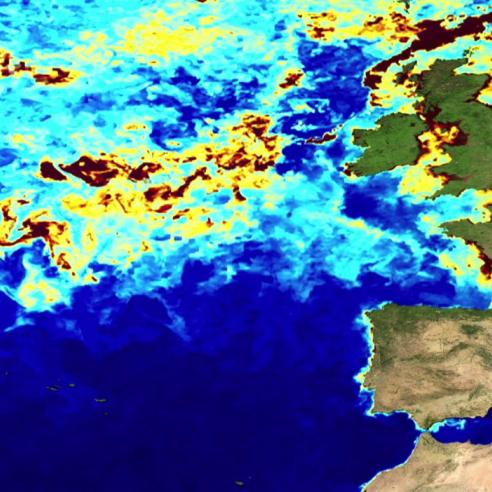
In the below Severe Storm RGB composite image, we've highlighted the active part of thunderstorms - where they have a strong updraft - in bright yellow. In these areas, the ice crystals are very small on the tops of the clouds. The parts of the deep convective clouds without a strong updraft are shown in the red tones, where large ice crystals are also present.
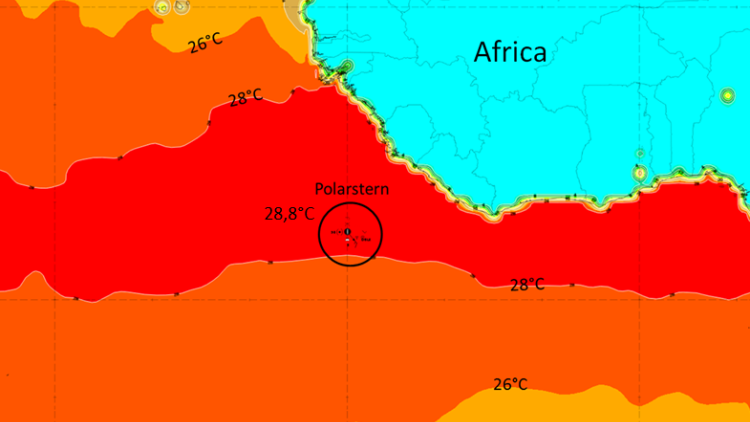
Here is where the RV Polarstern is currently located, with the described colours.

Now we'd like to provide you with some facts about the ITCZ’s climate. According to the Köppen-Geiger climate classification, the ITCZ has a tropical climate and the coldest month of the year is warmer than 18°C.
There are three climate distinctions that can be seen in the image below. These are a tropical rainforest climate (Af), tropical monsoon climate (Am) and tropical savannah climate (Aw);
- Typical in the “Af” area is an average precipitation of at least 60mm (2.4in) every month;
- In the “Am” area, the driest month has precipitation levels of less than 60mm and more than 4% of the total annual precipitation;
- In the “Aw” area, the driest month the precipitation level is less than 60mm and less than 4% of the total annual precipitation.
A good way to identify a tropical climate within a climate diagram is by the large seasonal differences. The ITCZ is characterised by strong rain and thunderstorms several times a day.

How does a thunderstorm develop?
A thunderstorm is a meteorological phenomenon that is accompanied by electrical discharges and thunder. Cumulonimbus clouds are a precondition for thunderstorms and develop particularly in the ITCZ. These types of clouds form because the troposphere is very high in comparison to other latitudes.
The prerequisites for a thunderstorm are:
- Moisture to form clouds and rain;
- Warm, unstable air in the lower layers of the atmosphere;
- Some kind of lifting force (this can form from sea breezes or mountain air for example).
The higher the potential instability, the bigger the thunderstorm potential. Thunderstorms vary in intensity and can be combined with rain, heavy rain, hail and violent gusts of wind. The humid air rises, cools down and forms tiny drops of water that become visible in the form of clouds. If these raindrops don't fall from the cloud, the clouds grow larger and are held in the air by the lifting force. If the raindrops cool down even further, they freeze into small ice balls which sometimes develops into hail.

It is very important for accurate weather forecasts to get the current weather conditions both on the ground and in the atmosphere. One way of gaining more information on the atmosphere is to send a weather balloon up into the sky multiple times a day.
The balloon can deliver precise data on the wind, air pressure, temperature, humidity and ozone concentrations. This data then gets recorded and evaluated. Each day, a radiosonde is sent from the RV Polarstern. The radiosonde is a battery-powered telemetry instrument carried by the weather balloon into these higher altitudes.
The meteorologist on board the Polarstern provided us with the data from one of these radiosonde trips. The diagram below shows the different information that was gathered on the temperature, dew points and wind in the upper levels of the atmosphere.
From the temperature profile you can conclude if the atmosphere is stable, unstable or indifferent. The shape of the curves provide you with information on the clouds, including their level and the cloud type. Furthermore, you can see if there is any possibility of a thunderstorm or showers.

What do the lines in the Radiosonde diagram above mean?
- Extended red horizontal lines These lines indicate Isobars, meaning 'air pressure'. Specifically, they are lines drawn on a map joining places of equal atmospheric pressure. The air pressure descends with increasing height. On the right-hand side of the table, you can see the matching height in km (e.g. 700 hPa corresponds to 3km height)
- Extended red vertical lines These are known as Isotherms. These lines connect points on a map that have the same temperature
- Extended red lines, from the lower-right corner to the upper left Dry adiabatic lines - indicating the rate of change of temperature in an air parcel of dry air rising or descending dry-adiabatically
- Extended green curves Humid adiabatic lines - these indicate the rate of change of temperature in a saturated air parcel as it rises humid-adiabatically
- Thicker, solid red line Indicates measured air temperature
- Dotted red line Indicates the measured dew point (the temperature to which air must be cooled to become saturated with water vapour)
- Thicker, solid green line This line indicates the International Civil Aviation Organization (ICAO) standard atmosphere. A detailed explanation of which can be found here.
The thick blue curve simulates the temperature of the ascending humid air within a cumulonimbus cloud. Between 600m and 14.5km, the temperature of this ascending humid air is always warmer than the ambient air temperature (thicker red line) and the reason for this strong upward motion.
We hope you enjoyed this latest instalment from the students which discussed the ITCZ in great detail. If you have questions or comments, feel free to leave a short reply in the post comments and the students will get back to you!
Next week's blog will be looking at the subtropical high in the Southern Hemisphere, with particular focus on the typical clouds and climate there.