10 June 2024
19 April 2024
About
The purpose of this study is to help estimate the individual impacts of current Aeolus observations and future EPS-Aeolus-like observations on NWP. This goal has been achieved by incorporating NOAA OSSE simulations of both Aeolus and EPS-Aeolus, which have been generated by KNMI using the Lidar In-space Performance Analysis System (LIPAS; Marseille et al., 2003, 2011) tool.

Objectives
The main tasks considered during this study are as follows:
- Configuring the Aeolus (-2) simulation through LIPAS.
- Providing advice on, discussing, and testing data assimilation aspects.
- Supporting OSSE calibration.
- Assisting in OSSE analysis and drawing conclusions.
Overview
Aeolus was the first and remains the only satellite capable of performing global 3D wind profile observations. It has demonstrated significant positive impact on global NWP models, as evidenced by ECMWF, Météo-France, Met Office, DWD, NOAA, JMA, NCMRWF and ECCC, surpassing initial expectations prior to its launch. Building on these successful outcomes, the phase 0 of preparation activities for a potential follow-on mission, EPS-Aeolus, commenced at ESA and EUMETSAT in 2020. Consolidated requirements have been compiled in a EURD document, and assessing their potential impact on NWP has emerged as a crucial focus. Typically, such assessment is conducted by OSSE exercises, which are complex due to the need to simulate all contributing components accurately, including realistic error variances and possible error correlations in both space and time.
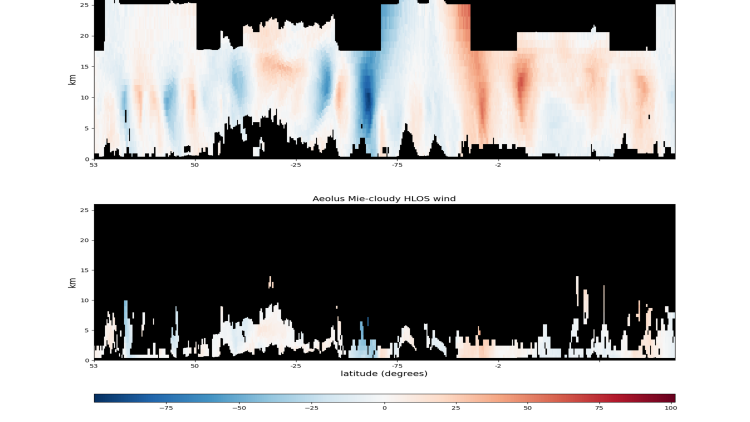
Already deeply engaged in the preparation of the Aeolus mission, KNMI developed the Lidar In-space Performance Analysis System (LIPAS; Marseille et al., 2003, 2011) tool, capable of simulating Aeolus observations. The initial task of this study was to adapt LIPAS to simulate EPS-Aeolus lidar measurements, aligning with the new requirements outlined in the DWL EURD.
Table 1 presents a summary of the statistics regarding LIPAS-simulated Aeolus and EPS-Aeolus HLOS winds. The rejection rate is determined based on the estimated random error standard deviation, with threshold values set at 8 m/s for Rayleigh winds and 5 m/s for Mie winds. The table highlights two significant findings (highlighted in bold): a substantial reduction in overall random error, decreasing from 5.74 m/s for Aeolus to 1.66 m/s for EPS-Aeolus (at comparable resolution), and a notable increased in the number of Mie-cloudy winds (factor of ~3).
| Rayleigh-clear | Mie-cloudy | |||||
|---|---|---|---|---|---|---|
| N | std (m/s) | rej (%) | N | std (m/s) | rej (%) | |
| Aeolus | 36,674 | 5.74 | 1.6 | 2,136 | 2.57 | 51.0 |
| EPS-Aeolus | 36,073 | 1.66 | 0.1 | 6,546 | 1.70 | 4.7 |
Table 1: Courtesy KNMI (From final report): Summary of statistics of LIPAS simulated Aeolus and EPS-Aeolus HLOS winds based on 6-hours (4 orbits) of data. N is the number of data, ‘std’ the random error standard deviation and ‘rej’ the rejection rate.
NOAA performed the OSSE calibration for the Aeolus experiment. Subsequently, they conducted an additional OSSE with EPS-Aeolus, during which observation errors were tuned to their system. The experiment highlighted the significantly enhanced impact of EPS-Aeolus compared to Aeolus. In particular, the root mean square difference (RMSD) reduction was approximately doubled with respect to the baseline, as depicted in Figure 2 this reduction amounted to about 8% for EPS-Aeolus and only 4% for Aeolus at the initial time.


