30 January 2023
21 November 2017
The Polar Multi-sensor Aerosol properties (PMAp) product provides Aerosol Optical Depth (AOD) at 550nm. For version 1 of the operational version of PMAp, which provides an AOD over ocean and under clear-sky, as well as partially cloudy conditions, data from two Metop instruments, GOME-2 and AVHRR, are used.
A new version of PMAp has been developed (version 2) extending the retrieval of AOD to land surfaces. PMAp version 2 provides improved sensitivity for retrieving AOD values for aged and optically thick ('thick dust') aerosols. It will also further improve the quality of the volcanic ash detection. These improvements will be made possible by additionally extending the used radiance range towards the blue and UV regions of the GOME-2 spectrum and by including information from IASI thermal infrared measurements.
Objectives
The aim of this study is to validate the Metop PMAp version 2 AOD product with modelled AOD values produced by a general circulation or (chemistry) transport model.
In addition, the validation shall include a case study of specific time-series of AOD values from either dust plumes, fires, volcanic eruptions, or other strongly polluting events, and for which ground-based data, both AOD and background meteorology, are also available.
It shall specifically pay attention to 'thick dust' events and evaluate the performance of PMAp to distinguish between clouds and aerosol for cases where the water uptake by aerosols plays a significant role.
The study aims to use a suite of satellite, as well as ground-based in-situ data, in order to validate both the PMAp products, as well as the model output itself. The network of aeronet in-situ aerosol measurements provides a transfer for the evaluation of model and PMAp product data, while both the model and the additional aerosol remote sensing products provide the necessary information on a global scale, as well as the details on the microphysical and chemical composition of the observed aerosol.
Overview
In this study, we have used the most recent version of the EMAC chemistry-climate model that is developed at the Max Planck Institute for Chemistry in Mainz (MPIC), Germany and The Cyprus Institute in Cyprus (CyI).
The advantage of this EMAC version is the detailed chemical and microphysical processes, and the relatively high resolution (~50–110km), which is unique for such comprehensive simulations on global scale.
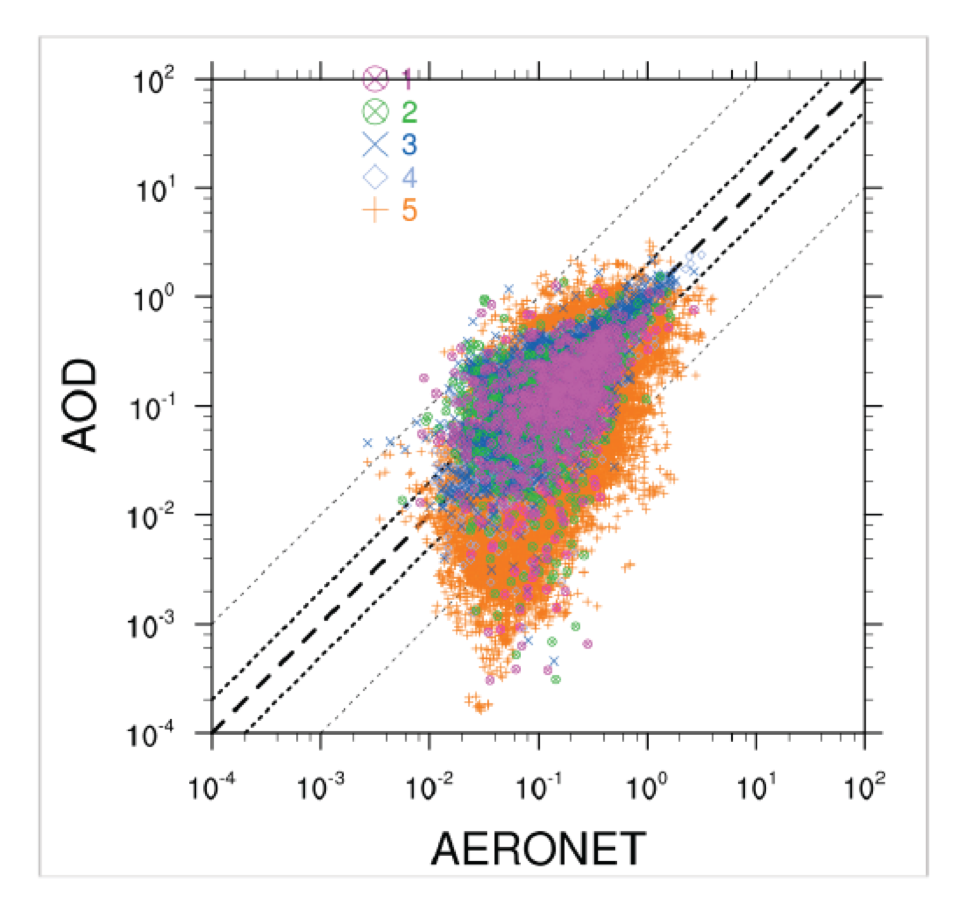
PMAp2.1 AOD (L2) products (Metop-A and -B) have been thoroughly evaluated versus model results (EMAC), other satellite products (L2 and L3) and AERONET observations over global and regional scales for two periods — June—September 2013 and February–May 2015.
Available L3 satellite products, such as MODIS and MISR, generally show a higher correlation, compared to AERONET observations, than level 2 products.
Level 2 satellite products, which are more difficult to process, are, however, required for fair comparison with the PMAp L2 products.

The global patterns of Aerosol Optical Depth (AOD) are fully reproduced by PMAp, when compared to the corresponding global maps by MODIS, MISR and EMAC.
The overall PMAp tendency in AOD is to provide slightly overestimated values for low aerosol loading conditions, together with slight underestimates for higher aerosol loadings. From the validation the lower sensitivity limit of PMAp can be set at 0.05 AOD.
The PMAp2 products compare well for many AERONET stations with ground observations, model results, and with widely available L2 and even L3 satellite products.
Level 3 data compared to AERONET (level 2) provide correlation coefficients r with values up to 0.8. MODIS AOD (coll. 6) — for the same validation period — presents maximum correlation coefficients up to 0.90 while Deep Blue up to 0.93. The variance for PMAp L2 AOD is with 0.5 on average lower than for MODIS AOD and with respect to AERONET.
PMAp performs well in most regions evaluated when compared to other the AOD products and AERONET, but exhibits some problems for regions with large variability in elevation (like North West America), for which also MODIS shows significantly reduced performance.
In particular, taking into account the two comparison periods, PMAp L2 AOD shows correlation r-values with respect to AERONET ranging between 0.41 and 0.99 with RMSE values ranging between 0.06 and 0.5, for the Metop-A platform (M02), and between -0.66 and 0.67 with RMSE values ranging between 0.06 and 0.32 for Metop-B (M01). M02 performs slightly better with respect to M01, for most regions, in terms of correlation performances.
Furthermore, PMAp turned out to provide the best correlation performances in the first comparison period, mainly for cloud coverage conditions and, thus, availability of co-located measurements useful for the comparison. For the same areas and comparison periods, MODIS L2 AOD (coll. 6) shows correlation r-values with respect to AERONET in the 0.14–0.93 range and with a RMSE ranging between 0.03 and 0.31.
Overall, the PMAp2 time-series comparison based on a 0.5 hour temporal collocation window and a 30km radius for the spatial collocation with respect to AERONET station observations, and with respect to the high-resolution EMAC one hourly model output, reveals best the differences and similarities between the various AOD products.
For PMAp, AERONET and EMAC the differences are most likely caused by cloud masking, which is differently pronounced depending on the region. The best agreement is found for the Caribbean, NE America, European and Asian stations, while globally most PMAp2 AOD time-series are generally supported by the EMAC results.


