28 March 2023
15 November 2018
Within the framework of New Product Development, we investigated and developed a new Ocean Colour Fluorescence Product from Copernicus Sentinel-3 OLCI and implemented a product validation and review process.
We aimed to deliver an advanced and robust algorithm, that uses OLCI spectral capabilities and ensures a high-quality fluorescence retrieval, meeting user requirements in open ocean and complex waters.
Phytoplankton absorb sunlight and use this energy through photosynthesis to produce organic material. Chlorophylls, present in all phytoplankton cells, induce two dominant peaks in absorption spectra, the primary in the blue (440 nm) and the secondary in the red part of the spectrum (675 nm). Phytoplankton also dissipate a fraction of around 3–9% of the absorbed solar energy through fluorescence, which generates a radiance peak around the wavelength of 681 nm. The concept of this fluorescence algorithm was to limit the analysis range to the red part of the spectrum and to approximate the phytoplankton fluorescence peak and the secondary absorption peak with two Gaussian functions, while all other absorption and scattering processes are captured by a slope and an offset.

Objectives
The goals of the study were to:
- Review user requirements for an OLCI phytoplankton fluorescence product.
- Review the current state-of-the-art in fluorescence developments and possibilities for innovation to enhance product performance, particularly using OLCI extended spectral capabilities.
- Propose a fluorescence algorithm that meets user requirements and is accurate and robust.
- Define the OLCI Fluorescence product and the uncertainties product.
- Prototype the OLCI Fluorescence algorithm.
- Validate the OLCI Fluorescence product.
- Propose a fluorescence product uncertainty requirement for the OLCI mission.
- Provide independent scientific feedback.
Overview
We proposed an algorithm, where two Gaussian functions, an exponential decay and an offset are fitted to OLCI TOA reflectances, as well as radiances, with:

With
O = offset, accounting for atmospheric and oceanic scattering processes
S = slope factor, accounting for atmospheric and oceanic scattering processes
A = factor of gaussian function at λA (absorption minimum of chlorophyll)
F = factor of gaussian function at λF (chlorophyll fluorescence peak)
λA = centre wavelength of the gaussian absorption minimum of chlorophyll
λF = centre wavelength of the gaussian fluorescence maximum of chlorophyll
wF = width of the gaussian fluorescence of chlorophyll
wA = width of the gaussian absorption of chlorophyll

| Input | Bands | Processing level | Description | Output | Description | Unit |
|---|---|---|---|---|---|---|
| LTOA | Oa08-Oa12 | Level-1B | Spectral Top-of-Atmosphere Radiance | L-FPH L-APD |
Radiance Fluorescence Peak Height Radiance Absorption Peak Depth |
mWm-2sr-1nm-1 |
| ρw | Oa08-Oa12 | Level-2 | Water-leaving Reflectance Surface Direction Reflectance, corrected for atmosphere and Sun specular reflection |
ρw-FPH ρw-APD |
Water-leaving Reflectance Fluorescence Peak Height Water-leaving Reflectance Absorption Peak Depth |
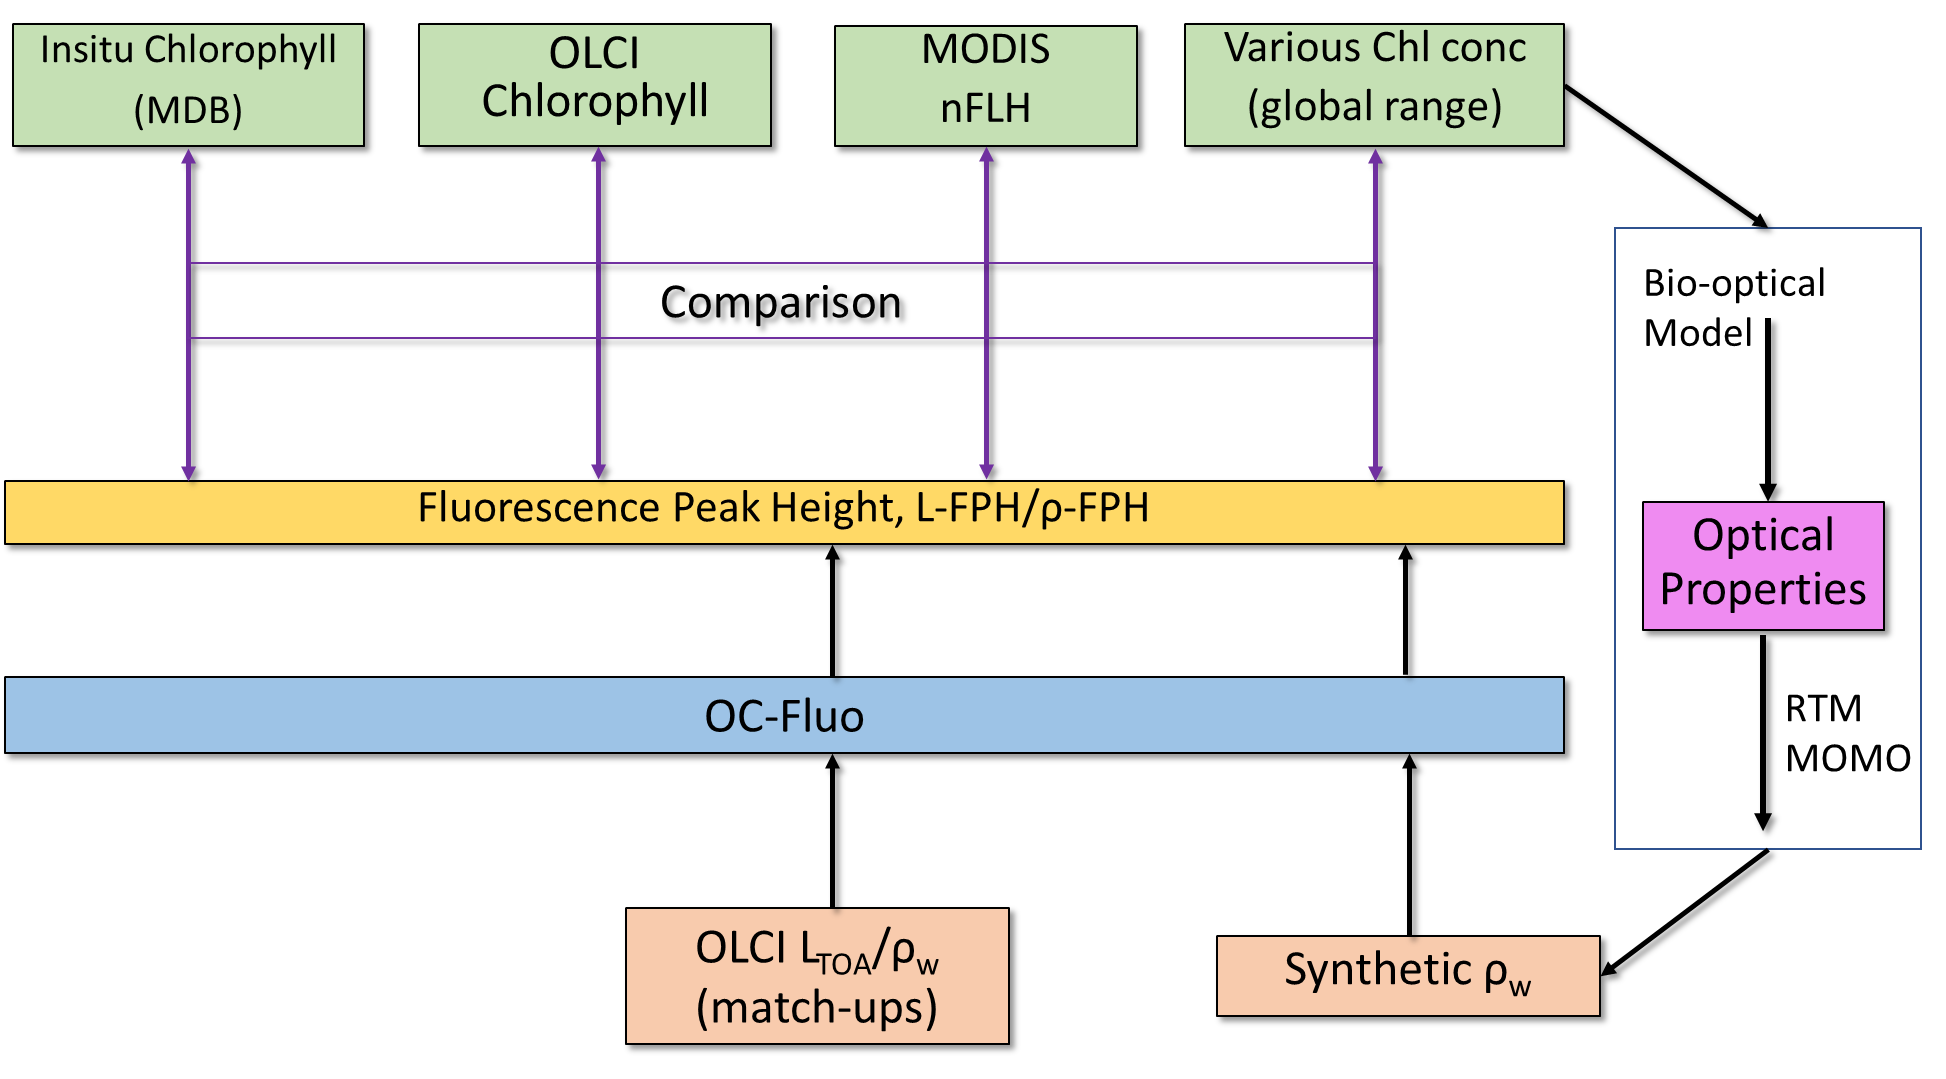
Application and validation
While validation is always a challenge, it is especially difficult in the case of measuring fluorescence from space, induced by natural sunlight. Remote sensing products are customarily validated against a ground truth. However, fluorescence is not an Inherent Optical Property, because it is not a property of the water body alone, but also a property of current and historical illumination. We do not have an independent ground truth for fluorescence, since this light emission is easily influenced by the in-situ measurement process causing photoinhibition. In-situ fluorescence measurements are typically obtained with active light pulses and, therefore, not comparable to sun-induced fluorescence. The common approach to validate fluorescence from satellite-based measurements is the comparison to chlorophyll concentration. Here, the strong correlation of chlorophyll fluorescence to chlorophyll concentration is employed, although the conversion of one measure to the other can vary by a factor of eight and there are a variety of factors influencing this.
The validation, as performed in the scope of this study, was an evaluation of the algorithm and its products on different levels using multiple sources. Neither of the validations compared two identical measures.
- Correlation with in-situ HPLC chlorophyll measurements.
- Correlation with standard OLCI chlorophyll products OC4me and NN.
- Inter-comparison with MODIs nFLH product (the only validation with another fluorescence measure).
- Correlation with chlorophyll from RTM.
- Diagnostic time series over five globally distributed regions.
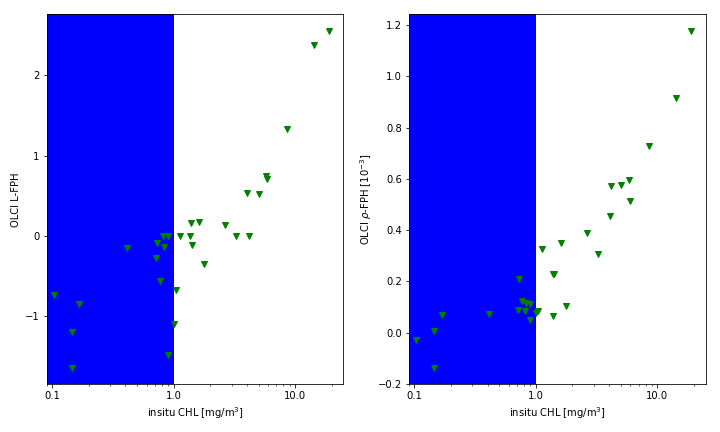
The main dataset for the validation of the OC-Fluo algorithm was the HPLC Matchup Database (MDB) which included HPLC data from NASA SeaBASS (Werdell et al., 2003) with OLCI match-ups (EUMETSAT Ocean Color In-situ Database, 2019), and is available at https://ocdb.eumetsat.int/. Most of the matchups are located in Santa Barbara Gulf off the coast of California (PIs David Siegel, Emmanuel Boss and Lynne Talley are gratefully acknowledged). Thus, the dataset is not representative for all kinds of waters, but the matchups are very well distributed throughout seasons providing examples of different levels of chlorophyll-a concentration.
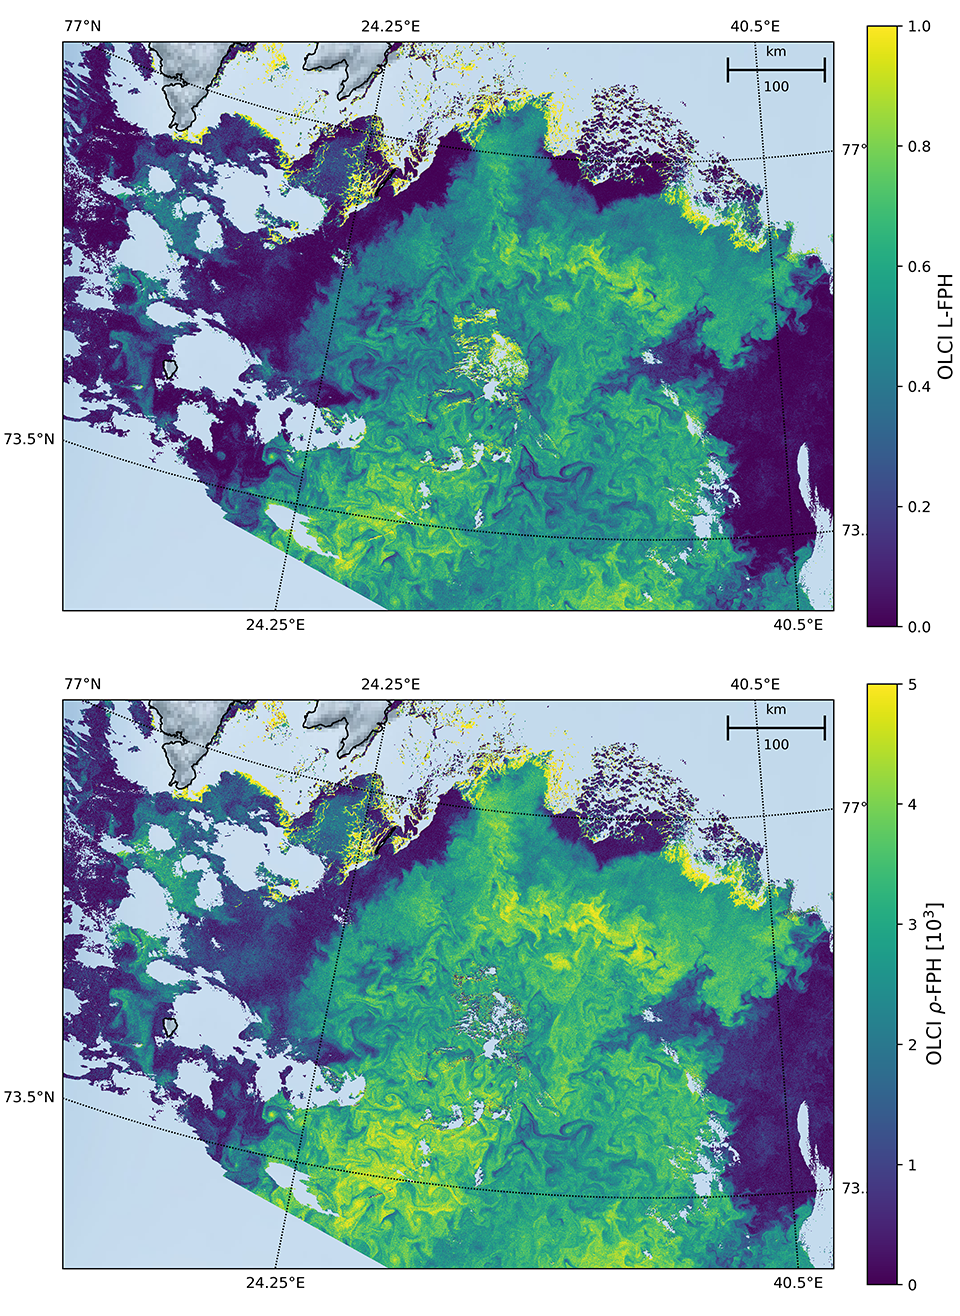
We also compared OC4Me and NN-Chlorophyll with L-FPH and ρ-FPH for different water types. Here, we show the comparison in the Barents Sea. For the comparison, it is important to note that the Neural Network Chlorophyll is more relevant for complex waters, whereas OC4me is more appropriate in open ocean waters. The scenes are displayed with only the processor’s default flags applied. In order to derive a quantitative measure, we also derived a linear correlation coefficient, R. A few studies show that on a local scale a linear relationship may exist (Fischer and Kronfeld, 1990), although other studies show that this relationship is strongly nonlinear (Babin et al., 1996). As a drawback of getting a good correlation and applying a simple general relationship, we derive the linear correlation coefficient R between FPH and the logarithm of Chl. Note that this coefficient is not necessarily a measure of the quality of the retrieval. For this pixel-wise correlation the OLCI matchup protocol (EUMETSAT, 2019) was applied.

nFLH from MODIS is a well-established remote sensing product and independent of our OLCI FPH products in terms of instrument issues as well as in terms of retrieval algorithm issues. Note that the MODIS nFLH algorithm is based on the fully normalized water-leaving radiances including BRDF correction (as described on the NASA Ocean Color webpage), but both our OLCI products still include BRDF effects. Both, MODIS nFLH and OLCI L-FPH are based on the physical radiances (the MODIS one has undergone atmospheric correction), where the spectral peak at 681 nm is expected to originate from the ocean. Accordingly, both measures are expected to be very similar in absolute values. However, differences are still to be expected because MODIS nFLH characterises the line-height of the measured spectrum at 678 nm and OLCI L-FPH characterises a peak height of a peak at 681 nm, which might be decreased by a dip at 673 nm.