16 February 2023
12 August 2020
Everywhere on Earth, particles are suspended in the air, with a high regional and temporal variability, and threaten our air quality. EUMETSAT is the technical agent and scientific leader, entrusted by the European Commission (EC), to implement and produce the Copernicus Sentinel-3 (S3) Near Real Time (NRT) Aerosol Optical Depth (AOD) product. It monitors, in less than three hours, the location, abundance, and long-range transport of all atmospheric aerosol particles.
Air pollution is a long-running global problem, sometimes named the ‘silent killer’. Tiny particles suspended in the air, known as ‘Particulate Matter’ (PM) are one of the major environmental causes of disease around the world. In particular, PM2.5 (PM of less than 2.5 µm size) is a key health risk factor in Europe, above others, such as noise, ozone, or radon (Hanninen and Knol, 2011).
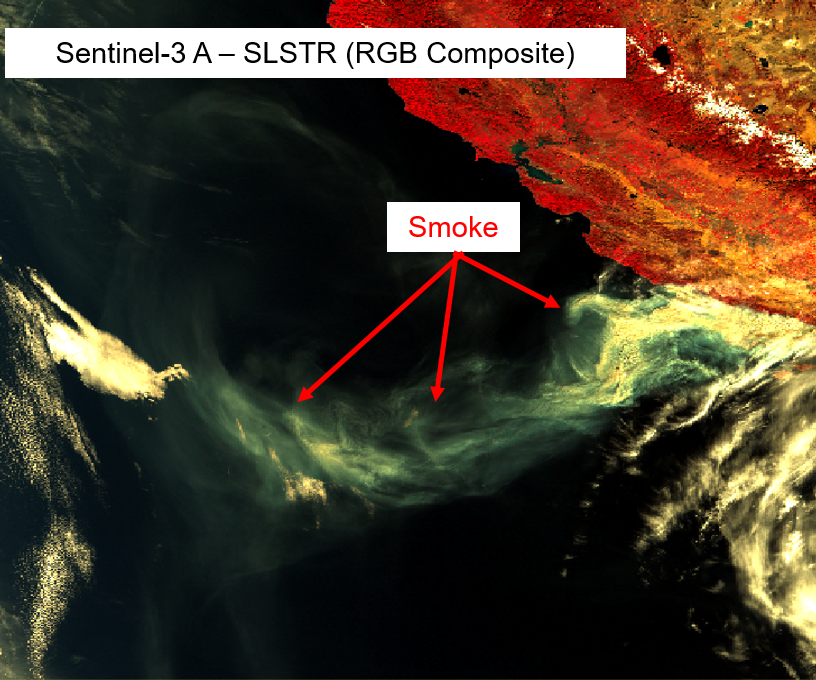
In addition to its core marine and continental objectives, in the daytime the Sea and Land Surface Temperature Radiometer (SLSTR), on board the Sentinel-3 A and B satellites detects the abundance of air suspended particles and monitors the immediate threats related to the variability and long-range transport of any type of air suspended particles. Commonly gathered under the name of ‘aerosols’, these are not only nitrates and sulfates from anthropogenic activities, but also desert dust, sea salt spray, smoke from wildfires (see Figure 1), black soot, and volcanic ashes.
Find out how to access the data
Objectives
The Copernicus NRT S3 AOD processor quantifies the abundance of aerosol particles and monitors their global distribution and long-range transport, at the scale of 9.5 x 9.5 km2. All observations are made available in less than three hours from the SLSTR observation sensing time. It is only applicable during daytime.
User attention is drawn to the different maturity levels of the various parameters available in the current version of the NRT S3 AOD product in Product Quality Status .
Background
What do we breathe?
Atmospheric aerosols are small and complex chemical mixtures of liquid and particles suspended in the air. Due to their tiny dimensions, they are usually invisible to the human eye at low concentration. However, they efficiently interact with solar radiation and strongly affect its distribution throughout the atmosphere (Dubovik et al., 2019). Their presence perturbs our climate system, total atmospheric energy budget, atmospheric visibility, human health and safety. Scattering and absorption by aerosols affect the actinic flux, and consequently modifies the photolysis rates of important processes in the atmosphere (Palancar et al., 2013). Furthermore, because of their interaction with the solar, Earth, and atmospheric radiations, aerosols also interfere with satellite observations dedicated to many applications such as air quality, climate and surface applications.
Aerosols differ from gases as they are bigger than molecules. There are several classifications of atmospheric aerosols but the most widely used is according to their size. They range from the smallest superfine mode, with diameters of a few nanometers (nm), to large coarse mode particles, with diameters to more than 100 micrometers (µm) or more. Between the superfine and the coarse mode particles are the fine mode particles, with diameters ranging from 0.1 mm to a few µm (Seinfeld, 1986). In polluted conditions, they are often denoted as particulate matter (PM): e.g. PM10 referring to the dry mass of particles with a diameter less than 10 µm.
Aerosol sources combine both natural and anthropogenic processes, and are of two types:
- Direct emission resulting from dispersion of material at the Earth surface (e.g. sea spray aerosol from sea surface or waves, dust from desert outbreak (see for example Figure 2), biomass burning aerosol, volcanic ash resulting from eruptions, primary organic aerosol, industrial debris).
- Indirect emission resulting from chemistry transformation of precursor trace gas, released by anthropogenic activities at the surface, leading to the formation of secondary aerosols (e.g. sulfates, nitrates, ammonium salts, secondary organic aerosol).

There are still some gaps in our understanding and modelling of aerosol sinks (IPCC: The Core Writing Team Pachauri and Meyer, 2014). After their release, they undergo various physical and chemical processes modifying their size and optical properties. They are generally removed from the air by dry or wet depositions, depending on their size and Earth’s surface characteristics, at the surface (Kerkweg et al., 2006; IPCC: The Core Writing Team Pachauri and Meyer, 2014).
The global total atmospheric aerosol mass is dominated by natural processes at the surface, in particular sea spray aerosol and desert dust. However, anthropogenic emissions (e.g. industries, vehicles, agriculture and wildfires) of both primary particles and precursor gases greatly increases the total aerosol load and can locally outweigh the natural aerosols (Andreae and Rosenfeld, 2008).
Why should we observe atmospheric aerosols?
The reasons are numerous:
- Aerosols directly influence the radiation budget of the Earth-atmosphere system through the scattering and absorption of solar and terrestrial radiation (Feingold et al., 1999). High concentrations of fine particles lead to reduced cloud droplet size, enhanced cloud reflectance (Twomey et al., 1984), and reduced precipitation (Rosenfeld, 2000; Ramanathan et al., 2001; Rosenfeld et al., 2002). Yet accounting for the effects of aerosol particles is very difficult since they represent one of the most complex atmospheric constituents. For example, it has widely been recognised that the lingering uncertainty in the knowledge of aerosol properties drives the global climate change estimation uncertainly (Dubovik et al., 2019). These large uncertainties of aerosol optical properties limit our climate predictive capabilities (IPCC: Solomon et al., 2007).
- Aerosols play a significant role in air quality, in particular near the surface. Due to the rapid growth of both population and economic activity, such as in the Asian region, increase in fossil fuel emissions gives rise to concerns about fine particles formation and dispersion. Aerosols include a variety of hazardous organic and inorganic substances, reduce visibility, lead to reductions in crop productivity and strongly affect the health of inhabitants in urban regions (Chameides et al., 1999; Prospero, 1999; Eck et al., 2005). In its last report (Clear the air for children, October 2016), UNICEF has emphasized these striking numbers: globally, 1), 2 billion children live in areas where outdoor air pollution exceeds international limits, 2) 300 million children live in areas where outdoor air pollution exceeds six times international limits. The Americas and Europe are also concerned: 120-130 (20) million children live in areas where outdoor air pollution exceeds (twice) international limits (cf. UNICEF, 2016).
- In the absence of clouds, aerosols interfere with the signal of interest on every optical satellite observation from passive sensors. Taking into account such an interference is critical for many applications like surface ocean colour (e.g. from the Copernicus Sentinel-3 OLCI L2 Ocean Colour product procured by EUMETSAT) or trace gas retrieval from any UV-Visible instrument.
Monitoring, forecasting and analysing our atmosphere composition — the Copernicus Atmosphere Monitoring Service (CAMS)
Implemented by the European Centre for Medium-Range Weather Forecasts (ECMWF) on behalf of the European Commission (EC), the Copernicus Atmosphere Monitoring Service (CAMS) will be one of the key users of the Copernicus Sentinel-3 NRT AOD product. CAMS provides continuous data and analysed information on atmospheric composition. This service globally analyses the current air quality in NRT, forecasts the situation a few days ahead, and consistently analyses retrospective data records for recent years, hence enabling a permanent assessment of the air quality that we breathe. It supports many applications in a variety of domains encompassing health, environmental monitoring, renewable energies, meteorology, and climatology. Five main areas are focused by the service: 1) air quality and atmospheric composition, 2) ozone layer and Ultra-Violet (UV) radiation, 3) emissions and surface fluxes, 4) solar radiation, 5) climate forcing. Daily global atmospheric composition relies on the forecasting of constituents such as reactive and greenhouse gases, ozone and aerosol particles.
To optimise the boundary quality of the forecasts, observations are assimilated and satellites are one of the main providers. Today, MODIS sensors on-board Terra and Aqua satellites procured by the National Aeronautics and Space Administration (NASA) and the Polar Multi-sensor Aerosol optical Properties (PMAP) from the Metop satellites procured by EUMETSAT are the operational aerosol observations assimilated by CAMS. In future, additional satellite aerosol observations will be added in the CAMS system including the NASA Suomi Visible InfraRed Imaging Radiometer (VIIRS) and the Copernicus Sentinel-3 NRT AOD.
See the PMAP details in the Product Navigator .
Overview of the algorithm
Processor version
The Copernicus Sentinel-3 NRT AOD product development, maintenance, evolution, and quality validation is under the overall leadership of EUMETSAT on-behalf of the EC. The first release of this product directly relies on the Software Processor, also named Instrument Processing Facility (IPF), v2.0, the Product Baseline Collection (BC) 1, and the Processing Baseline (PB) PB2.70-MARINE.
Comment about the nomenclature: The collection of IPF version and static Auxiliary Data Files (ADFs) is known as the PB. The PB number is the same for S3A and B. The PB is primarily internal to the Sentinel-3 Payload Data Ground Segment (PDGS). 'MARINE' in PB2.70-MARINE stands for the name of the EUMETSAT Sentinel-3 PDGS originally dedicated to the L2 Sentinel-3 Marine products, which is now extended to global NRT atmospheric applications. The BC is the product version. The BC may correspond to a collection of several PBs and is only modified if changes in the mission dataset are significant.
| Version | Status/Date |
|---|---|
| Processor V2.0 – Product Baseline Collection 1 Processing Baseline 2.70-MARINE |
Deployed on OPE on 18/08/2020 Available on ODA since 19/08/2020 Available on EUMETCAST, UMARF since 27/08/2020 |
| Processor v1.01 Processing Baseline 2.41 |
Delivered to EUMETSAT on 26/10/2018 Internal - Not deployed on OPE |
| Processor V1.0 Processing Baseline 2.34 |
Delivered to EUMETSAT on 26/04/2018 Internal - Not deployed on OPE |
Processor legacy
The developments included in the Copernicus Sentinel-3 NRT AOD product have benefited from the following supports:
- All the developments incorporated between the processor v1.0 and v2.0, as well as software anomaly corrections, were achieved by EUMETSAT's Remote Sensing and Products (RSP) division.
- The analyses of the satellite aerosol information content as a function of the measurement geometry has been lately inspired by concomitant EUMETSAT activities dedicated to the preparation of the future EPS-SG 3MI mission, and current aerosol algorithm developments from Metosat Second Generation (MSG), and PMAP from Metop A, B and C satellites. The crucial importance of geometry in the budget error is summarised in the recently submitted peer-reviewed paper B. Fougnie et al, 2020.
- The primary software frame relies on the processor v1.0, originally developed by the company ACRI-ST, in the frame of the Sentinel-3 Mission Performance Centre (MPC) contract, funded by Copernicus & procured by the European Space Agency (ESA). This software was based on the original AATSR aerosol algorithm from Swansea University (SU), developed in the ESA aerosol Climate Change Initiative (CCI) project . However, more developments were needed for the SLSTR NRT AOD processing.
- The original AATSR aerosol algorithm has mainly been developed by the team of Professor Peter North from Swansea University (North et al., 1996, 1999, 2002) and benefited from funding from ESA aerosol CCI activities, led by Dr Simon Pinnock (Technical Officer).
- Primary analyses related to the SLSTR dual-view configuration, as well as technical understanding of the processor v1.0, were provided thanks to Professor Peter North from SU.
- Exchanges from AEROSAT-AEROCOM, and APOLO workshops.
- Lessons from Karnieli et al. (2000) for the AFRI index, and Hsu et al. (2019) for the spectral relationships applied in VIIRS enhanced deep blue.
- The SLSTR Aerosol Retrieval Performance (SARP) project, funded and procured by EUMETSAT. Led by the Finnish Meteorological Institute (FMI) as Principal Investigator (FMI), this project has allowed to investigate the aerosol information content and the capability to retrieve AOD from the SLSTR sensor. Based on state-of-the-art radiative transfer simulations, reference land surface Bidirectional Reflectance Directional Function (BRDF) from the ESA ADAM database, and an independent algorithm (the SLSTR Dual View – SDV), actual aerosol uncertainties as a function of geometry have been characterised for any dual-view radiometers (SLSTR, AATSR).
- Cross-fertilisation between Sentinel-3 and PMAP Metop AOD developments by EUMETSAT.
- Results from the internship of Corso Quilici, BSc student, Evaluation of Sentinel-3 SLSTR AOD in complex environments – Focus on water surfaces, supervised by the EUMETSAT RSP division.
- Lessons learned from the Sentinel-3 OLCI AOD retrieval feasibility study, based on the multi-pixel approach from the Generalised Retrieval of Aerosol and Surface Properties (GRASP) algorithm.
- Exchanges about sea salt and oceanic AOD with Dr Samuel Remy, SLSTR Quality Working Group (QWG).
Product quality status
Note: users of the Copernicus Sentinel-3 L2 NRT AOD should note the following maturity labels of this product version attributed by EUMETSAT.
- The AOD over ocean surfaces is ‘Preliminary Operational’. Its scientific quality is considered to be approaching the expected requirements. Nevertheless, it is considered to have reached a level of maturity which can be safely exploited by users. Validation is being extended over a longer time series and a larger set of ground-based measurements. The completion of this validation exercise is expected within a few months, with fine-tuning continuing for the evolution to the full ‘operational’ maturity level, i.e. matching the expected quality requirements, within the year.
- The AOD over land surfaces is currently ‘Demonstrational’. That is the first version of this parameter and its product quality is not yet within the expected requirements. It is strongly advised that its use should be restricted to experimental purposes, while bearing in mind its known current limitations. The associated novel algorithm is in a ramping-up phase with further developments and optimisation led by EUMETSAT. Its preliminary operational maturity is expected to be reached in March 2021. A broader audience of users will be then invited for in-depth quantitative evaluation.
Algorithm capabilities
For more details on the specifics of the SLSTR instrument for joint aerosol and surface observations, see the focus section, and the recently submitted peer-reviewed paper from B. Fougnie et al. (2020).
AOD Ocean and Land — Commonalities
- Prior to the Level 2 processing, a correction of the radiometric calibration is applied to all the SLSTR L1B Top Of the Atmosphere (TOA) radiances in the solar channels S1-S6 (S4 being excluded) at the original sampling of 500 m. The correction is based on multiplicative radiometric coefficients derived from SLSTR-A summarised in the following technical note: S3MPC.RAL.TN.020-i1r0 - S3 SLSTR Visible and Short Wavelength Radiometric Calibration Adjustments – issue 1.0, written by Dave Smith (RAL), 16/07/2020.
Note: the same correction coefficients are equally applied to SLSTR-B since the radiometric consistency of both sensors have been aligned during the tandem Sentinel-3 A-B activities that occurred in June-October 2018. - All Level 2 NRT AOD parameters are provided at the super-pixel scale built by aggregating a block of 19 x 19 L1B SLSTR pixel. The super pixel resolution is about 9.5 x 9.5 km2 close to nadir.
- The aerosol retrieval is exclusively achieved during daytime with solar zenith angles lower than 80 degrees considered.
- Prior cloud screening is ensured by the SLSTR basic cloud mask available in the original L1B product. If less than 50% of any of the 19 x 19 L1B SLSTR pixels are cloud and glint-free, the super-pixel is then considered as invalid for L2 aerosol retrieval attempt.
- All cloud-free and glint-free L1B radiances are then arithmetically averaged out for each nadir and oblique view.
- The log (AOD) is fitted at the reference waveband of 550 nm. The actual AOD (550 nm) value is then derived via an exponential conversion avoiding any negative values.
- A posteriori AOD filtering is achieved after the L2 AOD retrieval, encompassing screening of cloud residuals, sediments in coastal areas, and other artefacts.
- The prior surface pixel classification is provided by the land / water mask available in the original L1B product.
- The set of aerosol models is based on CCI recommendations: two coarse mode (sea salt, desert dust), and two fine mode (weakly and strongly absorbing). All assume spherical particle properties computed with Mie code, except for desert dust, that assumes spheroid properties computed with T-matrix code (Dubovik et al., 2006).
- The reference parameter to be used is ‘AOD_550’ which gives the best quality of AOD (550 nm) only over ocean surfaces, a posteriori filtered out of retrieval defaults.
- In addition, the following parameters are provided: AOD (550 nm) over land with and without a posteriori filtering, spectral AOD at other wavelengths, spectral AOD uncertainty, Angstrom exponent between 550 and 865 nm, single scattering albedo (SSA), absorbing AOD (550 nm), dust AOD (550 nm), fine mode AOD (550 nm), spectral surface reflectance, and Aerosol Free Ratio Index (AFRI) for land continents (Karnieli et al., 2000). Error estimate in AOD (550 nm) is based on one standard deviation assumption.
AOD Ocean — Preliminary Operational
- All available views are used as independent spectral measurements in the retrieval state vector. Hence, the retrieval can either be performed with both views or only one if the other one is not available as applied to AATSR by the original SU algorithm (Professor Peter North).
- The spectral wavebands used in aerosol retrieval are: S2, S3, S5, and S6. S1 is excluded.
- The ocean surface reflectance is not jointly retrieved with aerosol, but estimated via the traditional surface model combining spectral reflectance from (Koepke et al., 1984), foam fraction from (Monahan and O’Muircheartaigh, 1980), and the glint specular reflection from (Cox and Munk, 1954).
- Ocean AOD (550 nm) non a posteriori filtered is available as ‘AOD_550_Ocean_NonFiltered’. The difference with ‘AOD_550’ will show the pixels screened by the a posteriori filtering.
AOD Land — Demonstrational
- The NRT aerosol retrieval over land surfaces is a linear weighted combination of two different methods:
- Geometry method combining the dual-view angular view.
- Spectral method exploiting each view independently and deriving the surface reflectance in the visible from the SWIR TOA reflectance.
- The weights on the geometry vs. spectral functions are primarily distinguished depending on the sampled dual-view geometry and the surface type.
- The overall tuning of the exploitation of the SLSTR geometry is based on the estimated aerosol information content as a function of the dual-view geometry variable across latitude, across nadir and oblique swath longitude, and Earth inclination (season). Such an analysis is supported by B. Fougnie et al. (2020).
- The land cover type is primarily estimated via the AFRI from the TOA radiances in the S3 NIR (865 nm) and S6 SWIR (2.25 µm). An AFRI of 1 indicates a very well developed and healthy vegetation, while values lower than 0.2 are associated with bright bare soils such as deserts. Values from 0.4 to 0.8 indicates a mix of beginning of vegetation, urban and other hybrid soils (see Figure 3).
- The SLSTR dual-view geometry is judged as favourable when the minimum sampled scattering angle across both views is lower than 110 deg.

- The land surface model in the geometry module is the multi-angular model developed by Swansea University (SU) and successfully applied to the (A)ATSR sensors (North et al., 1996, 1999, 2002). Spectral channel weights are applied depending on surface type and sampled geometry in order to 1) minimise spectral surface brightness (e.g. too bright vegetation at 550 nm and 865 nm), and 2) mitigate uncertainties in the spectral shape of the land Bidirectional Reflectance Distribution Function (BRDF) (e.g. high vegetation spectral anisotropy at 550 nm in case of large scattering angle).
- The land surface model in the spectral module is mostly applicable over surfaces with AFRI larger than 0.4. It takes benefit from the known spectral relationships between the TOA reflectance in S6 and benchmark surface reflectance in S2, as successfully applied by the NASA Deep Blue team on MODIS C6, SeaWIFS v3 and VIIRS (Hsu et al., 2013). The SLSTR spectral coefficients are, at this stage, empirically tabulated as a function of AFRI inspired by the VIIRS enhanced deep blue ones (Hsu et al., 2019).
- The use of the S6 channel (1.6 µm) is overall minimal, and only restricted to bare soils with NDVI SWIR < 0.2 to ensure spectral SWIR consistency across S5 and S6 channels.
- The empirical smoke index relies on the differences between AFRI and the visible spectral radiances. It is currently only available over vegetated lands, at the experimental stage.
- The AOD parameters are given in ‘AOD_550_Land_Experimental_NonFiltered’ and ‘AOD_550_Land_Experimental_PostFiltered’. The difference between both parameters being the AOD pixels removed by the a posteriori filtering.
Overview of the performance
Evaluation status
A complete validation is ongoing by EUMETSAT, in collaboration with CAMS developers and supported by feedback from QWG members. The preliminary evaluation below will be regularly updated on this website page and detailed further in a public validation report.
AOD Ocean — Preliminary Operational
- It is expected that global ocean performance remains similar to the previous processor version (v1.0): i.e. a very good consistency with MODIS Terra AOD (550 nm) Dark Target Ocean Collection 6.1 over open remote oceanic areas. Near-simultaneous and spatially collocated L2 AOD pixel match-up over one year (2019) showed correlation in the range of 0.89:0.96 in the Atlantic oceans (North and South), and 0.74:0.83 over Indian and South Pacific oceans. Current reprocessing with processor v2.0 has so far showed similar trends over winter 2019-2020 (see Figure 4).

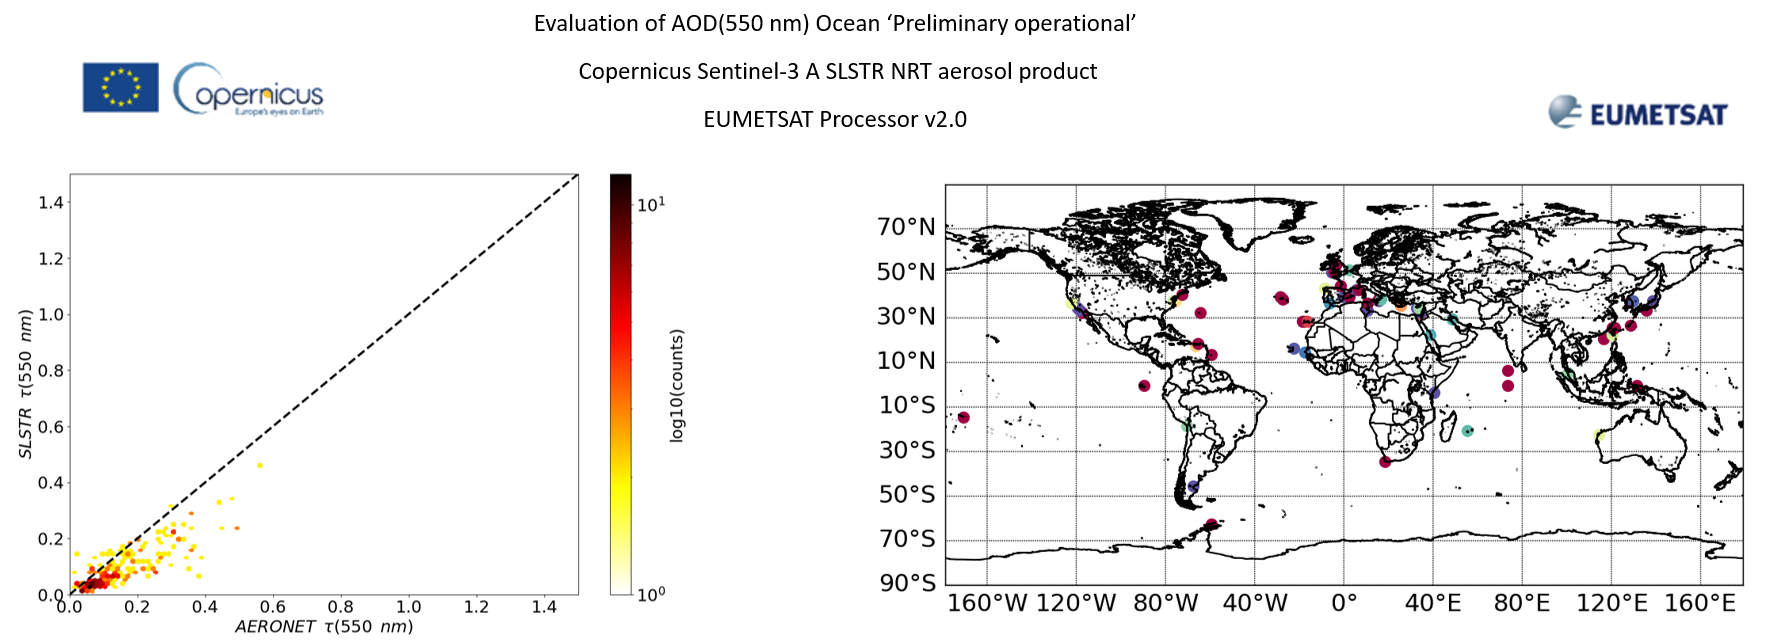
- Preliminary validation of the SLSTR AOD (550 nm) with AERONET, over two months (December 2019 – January 2020) shows a very high correlation of 0.83 and a Root-Mean-Square Error (RMSE) of 0.08 for all ranges of AOD values. It has to be emphasised that these numbers mix both open remote oceans and coasts without further distinction (see Figure 5).
- SLSTR AOD(550 nm) is systematically lower than MODIS Terra and Aqua AOD (550 nm) Dark target Ocean Collection 6.1: average difference of -0.03:-0.05. MODIS Terra, and, coincidently, Aqua, AOD (550 nm) ocean (open and/or coasts) seems to have a positive bias of +0.04 (Levy et al., 2018). Note: with the new processor v2.0, a slight decrease of SLSTR AOD (550 nm) values in open oceans of the order 0:01:0.03, depending on the regions and seasons, has been observed as the consequence of the radiometric calibration correction for both views primarily, and the fitting of log (AOD) instead of (AOD) subsequently.
- The radiometric calibration correction, especially in the SWIR, is expected to have reduced the AOD (550 nm) bias in case of large abundance of coarse particles (sea salt and dust): e.g. up to -0.04 over thick Saharan dust plumes transported over the Atlantic in December 2019 and April 2020. Further analysis is on going to complete the assessment impact of the full radiometric calibration correction.
- Most of the sediment contamination in the vicinity of estuaries and rivers, such as close to India, Thailand, East China and North-East of South America coasts, are well removed thanks to the a posteriori filtering.
AOD Land — Demonstrational
- The overall performance of the SLSTR NRT AOD(550 nm) over land must firstly be separated between 'favourable geometry' (i.e. minimum scattering angle < 110 deg) and 'unfavourable geometry' (i.e. minimum scattering angle > 110 deg).
- The best AOD (550 nm) performance is obtained in case of SLSTR 'favourable geometry', occurring mostly on the half Eastern side of both nadir and oblique swaths for all latitudes during the winter, and in the southern latitude (i.e. < 20 deg North) for the whole oblique swath during the summer.
During winter 2019-2020:
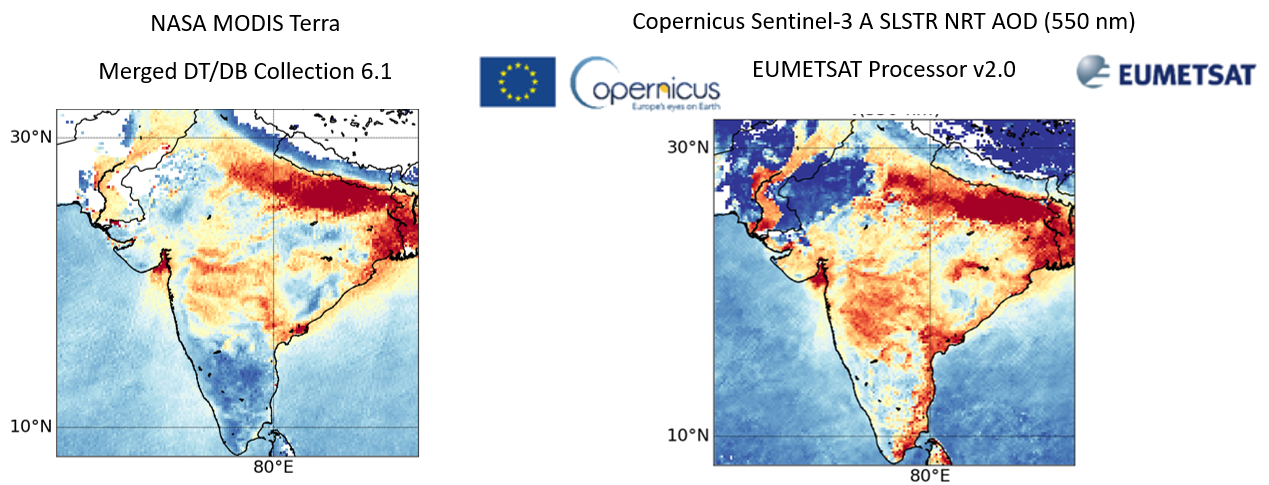
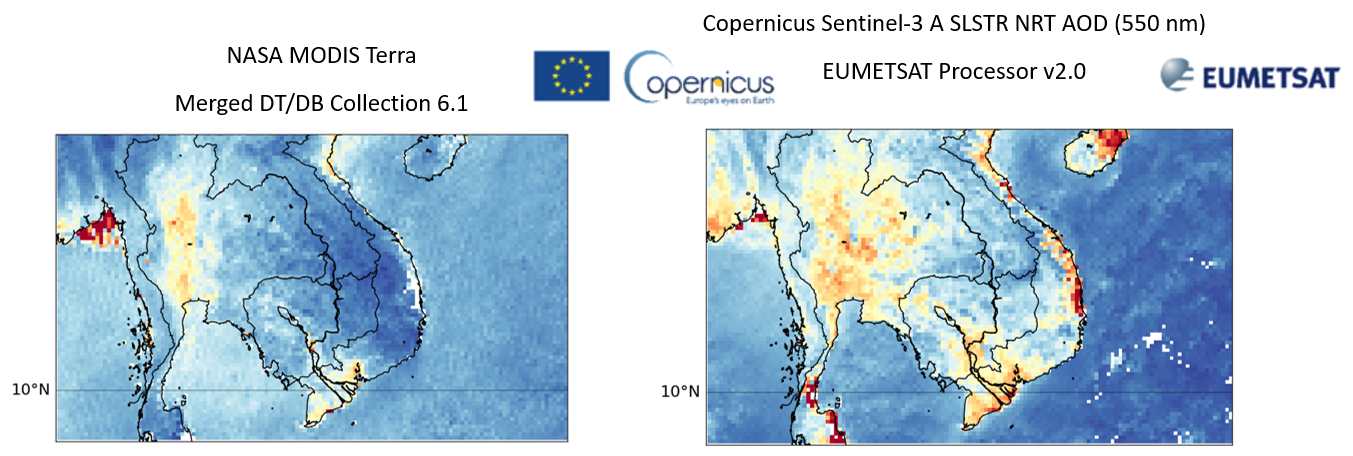
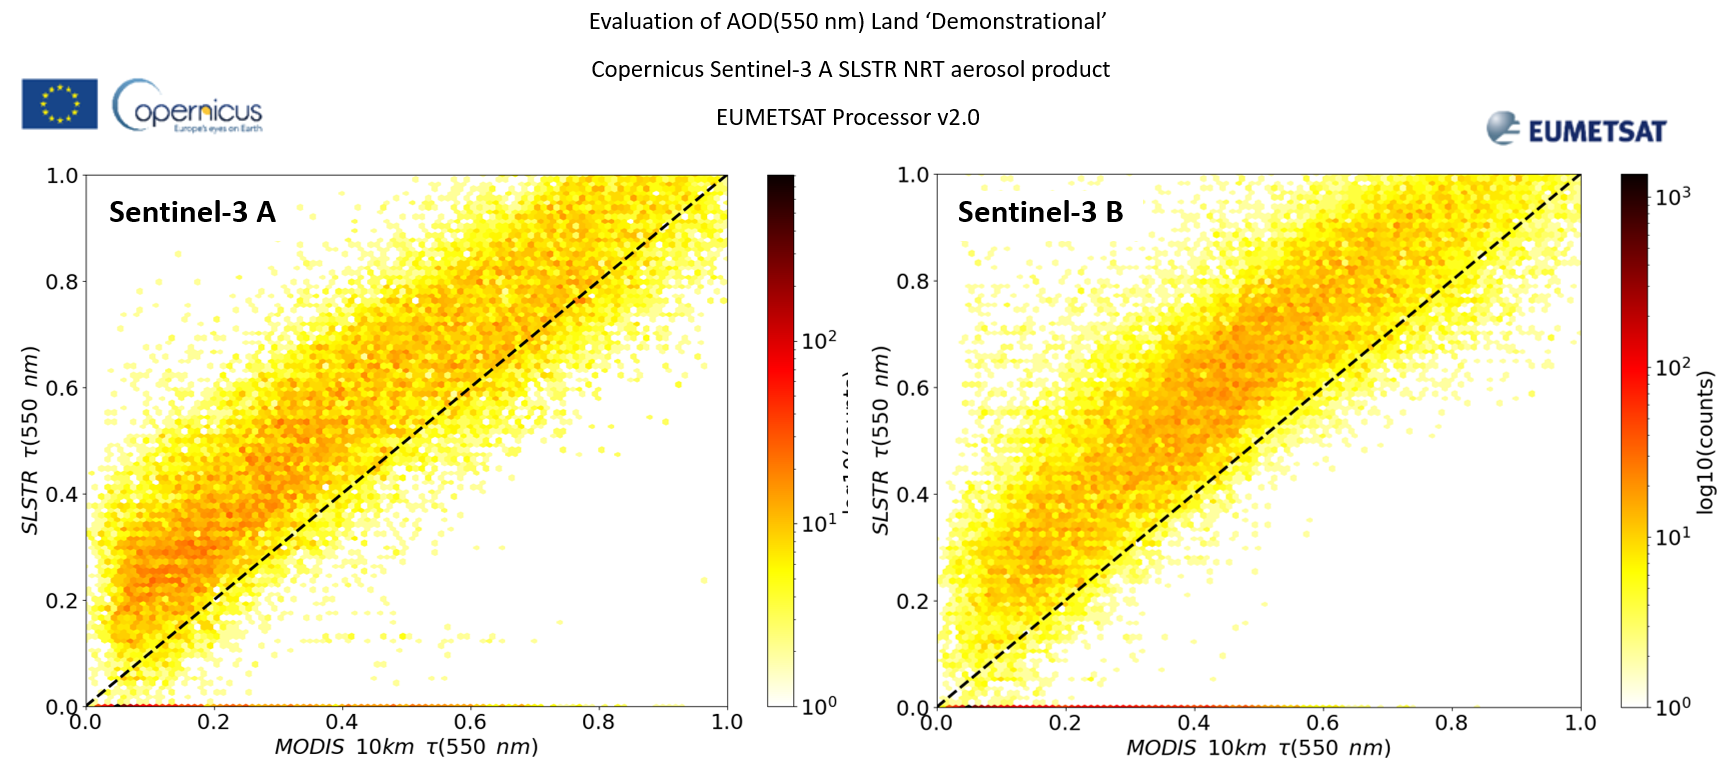
- Near-simultaneous and spatially collocated L2 AOD pixel match-up SLSTR (AOD 550 nm) – MODIS Terra Merged DT/DB Collection 6.1, exhibits very good correlation: >0.85 over India, 0.64 over Thailand. Average deviations are variable: between 0.06 (India) and 0.056 over Europe. (See Figures 6-8).
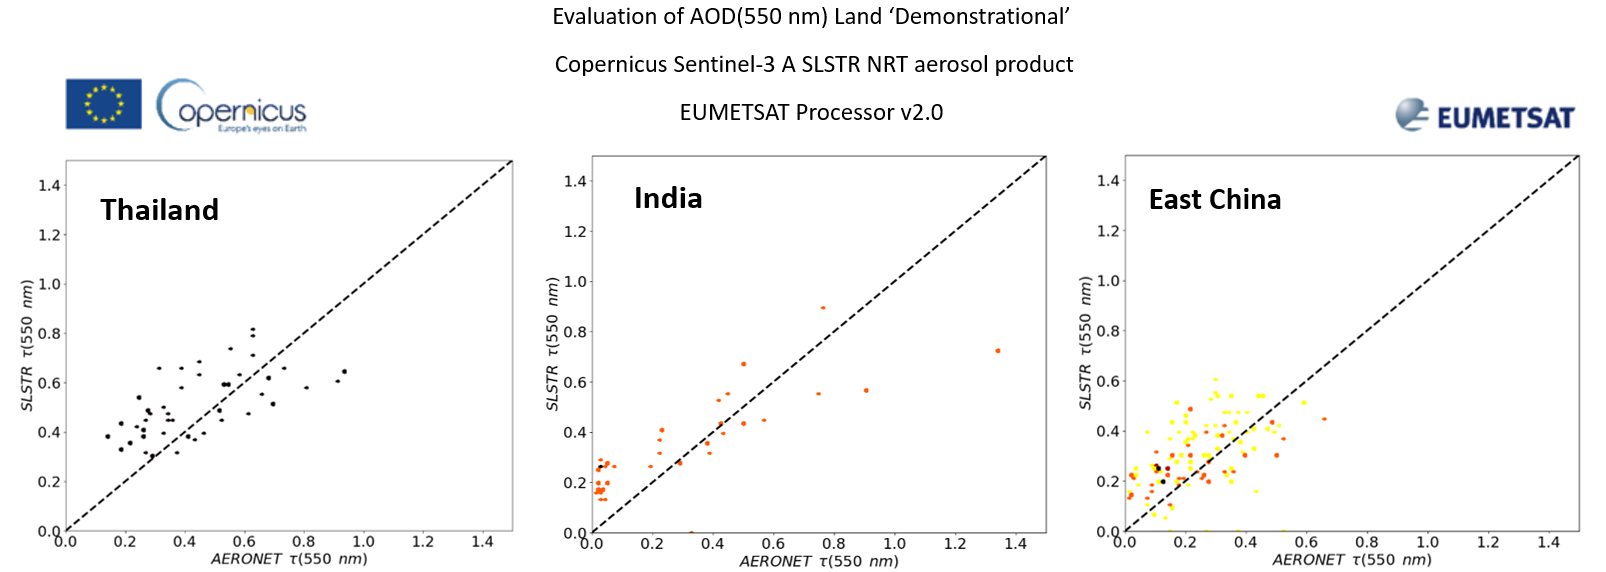
- Preliminary regional validation with AERONET shows very high correlation over major polluted areas, impacted by heavy industrial/anthropogenic pollution and biomass burning: ~0.91 over India, ~0.74 over Thailand and Australia, ~0.5 over East China, ~0.62 over South-America. Lower correlations are expected over less polluted areas (such as Europe and the USA). Average differences vary between 0.02 (India) and 0.09 (Europe, South America).
- Overall preliminary worldwide validation with AERONET shows a good correlation of 0.63 and average differences of 0.09.
During July 2020:
- Worldwide near-simultaneous and spatially collocated L2 AOD pixel match-up SLSTR (AOD 550 nm) – MODIS Terra Merged DT/DB Collection 6.1 exhibits encouraging correlation, ~0.71.
- Very high performance is expected over South America, such as during Amazonia forest fires (to be further verified).
Known limitations
L1B VIS/SWIR radiometric calibration information
- Even if a correction of the SLSTR calibration has been proposed for the solar channels (S1-S6), the calibration remains under assessment and the root cause of some discrepancy, not yet determined, is still under investigation.
- The correction coefficients are estimated over bright desert sites from a consensus of four expert groups. Their validity over dark targets (e.g. vegetation, open remote oceans) is under further verification.
- These corrections should be used with caution, as it is possible that the differences are scene dependent.
- Non-linearity effects at low radiance range are not yet fully characterised.
AOD Ocean and Land — commonalities
- Spurious night-time granules may be generated, sometimes, as a result of incorrectly screened large Solar zenith angle in the oblique view. They should be ignored by filtering out granules with solar zenith angle, in the nadir view, larger than 80 deg.
- The additional aerosol parameters such as uncertainty, angstrom, SSA, etc…, are not yet comprehensively validated. Therefore, they shall be used with great caution until the EUMETSAT validation is finalised and made available.
- SLSTR-A and B AOD alignments still need to to be verified. SLSTR-A and B TOA radiances were aligned during the Tandem activity (June-October 2018). The benefits or possible residual impacts are under verification for L2 NRT AOD.
- Software optimisation w.r.t. low aerosol signal is under further consolidation to better stabilise fraction AOD retrieval precision.
AOD Ocean — Preliminary Operational
- The actual AOD ocean validation is not completed: Although it benefits from the previous processor version, the actual validation from current processor v2.0 is under further completion by including longer time series of AERONET stations, Maritime Aerosol Network (MAN) ship-based measurements, and satellite inter-comparisons: primarily near-simultaneous collocated L2 with PMAP Metop and MODIS Terra, and weekly/monthly aggregated MODIS Aqua and VIIRS.
- The a posteriori filtering over remote oceans (far away from coasts) may be too stringent: Fine-tuning to better disentangle good and bad AOD quality is on going.
- Potential minor negative bias: AERONET validation over a two-month period (December 2019–January 2020) suggests a systematic negative deviation up to -0.04. Further analyses continue with regional and global ocean analyses in order to determine the nature of this potential bias, and whether it is specific to coasts and/or limited latitude regions.
- Higher uncertainties in coastal areas as well as shallow lakes are expected due to the challenge of disentangling the mix of shallow water and land surface brightness with aerosol scattering.
- The overall assets and drawbacks of the oblique view in the AOD (550 nm) retrieval over ocean is under characterisation. As a potential impact, some North-South inconsistencies in the average (background) AOD values were identified with the v1.0 processor. Although probably reduced in this release, this aspect remains under further verification.
- Higher uncertainty in the southern rough ocean is expected due to the high difficulty to separate bright whitecaps and sea spray.
AOD Land — Demonstrational
- Higher uncertainties over hybrid/urban soils and unfavourable geometry. Associated AODs are too high due to inaccurate spectral coefficients used for this type of situations. Users are strongly advised to disregard aerosol pixels with AFRI values in the range of 0.6:0.8. This typically occurs during the summer over western Europe. See Product quality status .
- Positive bias of the order 0.1-0.15 for low AOD (550 nm) values (i.e. < 0.2) and unfavourable geometry is suggested thanks to the validation with AERONET. Situations with favourable geometry may still exhibit such a bias, although seemingly at a lower magnitude.
- Limitations due to remaining / unfiltered cloud residuals. This mostly occurs in cases of broken small clouds over warm surfaces (summer over Europe, Asia, USA), and over the Amazonian forest (north and eastern coasts). This is a direct consequence of under detection by the SLSTR basic cloud mask, and unfiltered a posteriori AOD results. This leads to too high AOD outliers, and high standard deviation in SLSTR-AERONET AOD (550 nm) scatter-plots.
- Too low AOD values over complex topography with low aerosol pollution. Suspected root cause is Rayleigh correction inaccuracy with regard to high surface altitude.
- Too high AODs over very bright surfaces (deserts). Overall, such surfaces remain challenging, due to the lack or contrast between aerosol signal and the underlying surface brightness (e.g. Sahara).
- Transition Land/Ocean may be too sharp in some areas.
Recommendations to users
Users are advised to consider the key assets and possible limitations from above together with the fact that the current version of the NRT Copernicus S3 AOD product has different maturity labels for ocean or land. Therefore, it is strongly recommended users consider these products with the necessary precautions, bearing in mind this difference of maturity labels. Further improvements to the S3 NRT AOD product are planned, including the optimisation of the spectral constraints over land continents, in case of unfavourable dual-view geometry, a comprehensive global validation, and additional updates following feedback from selected Sentinel-3 NRT atmosphere experts.
Access to Sentinel-3 NRT AOD products
Users can access data through the following links:
- Access for S3VT Marine and Atmosphere sub-groups though On-line Data Access (ODA). Members of other S3VT sub-groups are invited to contact the User Service Helpdesk
- Alternative access upon request to the off-line production (see hereafter).
- Access through EUMETCAST (from 27 August 2020 onwards) — Contact the User Service Helpdesk
- EUMETSAT Data Centre via the Earth Observation Portal (EOP) : for all public users (from 27 August 2020 onwards).
Collecting your feedback – Additional on-line and off-line data (upon request)
All public users can look at the daily monitoring of the Copernicus Sentinel-3 NRT AOD from S3A and S3B via the EUMETSAT Monitoring and Evaluation of Thematic Information from Space (METIS) AOD website .
In addition, a series of S3 NRT AOD datasets produced off-line from the same EUMETSAT processor v2.0 can be made available upon request (see EUMETSAT point of contact below). This includes the following:
- Worldwide reprocessing of past S3 AOD dataset for some months of 2019 and 2020.
- Specific regionally and/or temporally limited reprocessing may be addressed.
- Possible other ancillary data and/or expert advice support.
Overall, EUMETSAT welcomes feedback from users at any time.
Focus on the SLSTR instrument — the asset and drawbacks of dual-view for aerosol observations

The Copernicus Sentinel-3 SLSTR instrument is a dual-view radiometer with a strong legacy from previous (A)ATSR instruments on-board the ESA ERS-1, ERS-2, and ENVISAT satellites. This technology allows the same scene to be measured with a close-to-nadir view and an oblique view with a zenith angle of 55 degrees (see Figure 10). SLSTR spectral coverage goes from the green (550 nm) through the SWIR to the thermal infrared. This has originally been designed for Sea Surface Temperature (SST) objectives, to enhance the correction of atmospheric path lengths in the thermal infrared. The capability of deriving aerosol properties from a dual-view sensor was then illustrated by various different research groups (SU, FMI, Oxford University) essentially funded by ESA aerosol CCI activities.
For any satellite sensor (mono or multi-viewing), the main challenge of retrieving aerosol properties after cloud filtering is the decoupling of aerosol scattering and land surface reflectance. This is especially true over the so-called bright surfaces: i.e. when the land surface reflectance highly dominates the overall TOA measurement. In the absence of a polarimeter, such a decoupling can be done via:
- spectral constraints, assuming spectral land reflectance is known or can be easily determined. This usually requires not only a large spectral coverage (from deep blue to the short-wave infrared), and a very high radiometric and spectral calibration quality;
- or with geometry constraints: i.e. thanks to multi-viewing sensors, we can sample the same scene with different scattering angles and isolate directional components of both aerosol and land surface scattering. However, as explained by B. Fougnie et al. (2020), a large fraction of the phase function must be sampled to allow such a decoupling.
The primary challenge of any dual-view sensor, SLSTR and (A)ATSR is that, with only two views, only a limited range of the scattering angles (and, therefore, the phase function) will be sampled everywhere on Earth, regardless of the dual-view configuration/orientation (see Figure 11). While some parts will sample both forward and backward scattering, other areas will always be measured in the so-called backward scattering corresponding to effective bright surface (e.g. vegetation hotspot) and weak and/or complex aerosol signal. As a consequence, the primary use of geometry constraints on dual-view measurements is not enough, and always require the addition of spectral constraints to allow a consistent aerosol retrieval quality.

The variation of the measured range of scattering angle with a dual-view sensor is primarily a function of latitude, but also longitude across-swath and season (due to the Earth inclination variability). In the case of SLSTR, since the dual-view configuration has been rotated from (A)ATSR with the oblique view measuring backward with regard to the satellite motion (see Figure 10), the so-called unfavourable geometry (i.e. only backward scattering measurements) is primarily located (see Figure 11):
- during summer: essentially in the north, roughly above 20 degrees south;
- during winter: essentially on the western side of the nadir and oblique swaths.
From the geometry constraints point of view, thanks to the dual angular view orientation, a large amount of aerosol information (with low uncertainty) is expected to be available in the south (over both continents and oceans), and on the eastern side of the swaths during winter.