

24 April 2023
05 June 2018
Statistical retrieval are popular inverse methods for atmospheric sounding, with long heritage. They model the relationship between observations and the parameters to be retrieved, based on a large representative dataset. The statistical methods are intrinsically much faster than inverse methods requiring explicit forward computations with a radiative transfer model (RTM) in the retrieval process, e.g. variational methods, as RTMs can me numerically costly.
The latest evolution of the Piece-Wise Linear Regression (PWLR) algorithm (see IASI L2 v6 validation report) aiming for an ‘all-sky’ temperature and humidity sounding from EPS/Metop, is part of the IASI Level 2 processor v6. The method, aka PWLR3, nominally exploits IASI measurements in synergy with collocated microwave data from the AMSU and MHS companion instruments onboard Metop. The PWLR3 also meets the timeliness requirements for regional applications.
Objectives
The objectives of the PWLR3 developments are to improve the operational microwave and infrared baseline, and to consolidate and demonstrate the fall-back IR-only mode of the algorithm.
Overview
An introduction to the PWLR3
The top of the atmosphere radiances observed by hyperspectral sounders are a complex function of the geophysical parameter state vector to be retrieved. Furthermore, two different state vectors can result in the same observation, and are, therefore, not a unique state vector corresponding to a given observation.
With the piece-wise linear regression (PWLR), the overall non-linear relationship between observations and state vector parameters is approximated by multiple linear models, in different classes. If the classes are sufficiently small, this retrieval method can be shown to be equivalent to optimal estimation: "Thus linear MAP [maximum a posteriori] solution can be regarded as a simulation of a multiple regression method where coefficients are found which best relate the state to the measurements." [Rodgers 2000]. Figure 1 illustrates the concept of piece-wise linear regression.

The leading principal components scores of the measurements are used as input to the PWLR retrieval. This is to remove the collinearity, which would be present if all channels were to be used as predictors, and also, consequently, reduces the dimensionality (typically by one to two orders of magnitude).
The first scores are also used to determine the regression classes, with the aim of grouping meteorological situations corresponding to similar types of observations in the same training subsets, regardless of their actual location on Earth or time of the year, etc.
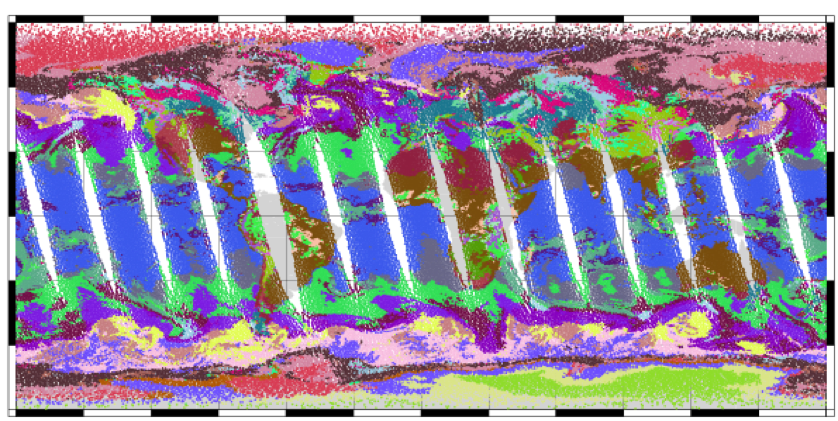
Within these subsets of the overall training set, we can see that the linear model is a more valid approximation. The classification itself is obtained with the K-means clustering technique applied to a subset of the leading PC scores. Figure 2 illustrates the result of such a clustering with IASI data from ascending nodes, where each colour corresponds to a particular class identifier.
The PWLR3 (PWLR-cube) is a 3D retrieval, exploiting measurements from a group of adjacent pixels to perform retrievals in each of the individual pixels.
The rationale is to take advantage of the horizontal correlations that exist in the atmosphere, to bring additional information in a given pixel from its neighbourhood. For instance, in the case of clouds affecting some pixels, the information below the cloud level coming from the clear-sky or less cloud-affected adjacent pixels can be exploited.
The 3D correlations, which are exploited in this approach, have a regularising effect in the vertical as well as in the horizontal on the solution across all adjacent pixels. The training is performed with about 100 millions of pairs of IASI (+MHS +AMSU) observations and collocated ERA-5 atmospheric profiles [www.ecmwf.int/en/forecasts/datasets/reanalysis-datasets/era5] of temperature, humidity and ozone, as well as the atlas CAMEL (University of Wisconsin) for the land emissivity.
Latest validation results
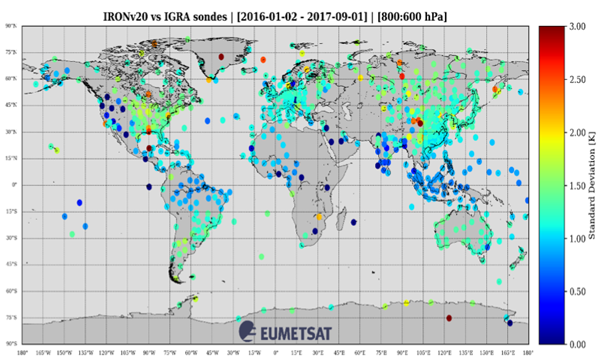
The temperature and humidity profiles retrieved with this algorithm are compared to radiosonde in situ measurements from the IGRA database. The match-up criteria are sonde and satellite data within 3 hours and 50 km.
Twenty months of IASI-only products have been reprocessed and compared to radiosondes, spanning January 2016 to September 2017. Figure 3 shows the standard deviation between IASI and sonde atmospheric temperature between 600 and 800 hPa. The few outlying stations may be explained by the absence of specific quality control of the sonde-satellite match-ups.
This IR-only product assessment holds about 50% of the data, which includes some pixels affected by clouds. Figure 4 and Figure 5 show the vertical statistics of comparing in situ temperature and humidity to IASI-only retrieved profiles, followed by a time series of the mean difference and standard deviation for temperature and humidity at 500 hPa.


The EARS-IASI L2, a new and fast regional service
EARS-IASI collects IASI instrument data from Metop satellite-passes via a network of HRPT stations (Figure 6) and retransmits Level 1c products via EUMETCast and the GTS.

The EARS-IASI service was extended in November 2016 to include L2 processing. The EARS-IASI L2 products are in HDF5 format and contain profiles of temperature and humidity derived from IASI, AMSU-A and MHS measurements from Metop-A and Metop-B, generated with the Piece-Wise Linear Regression-cube (PWLR3) algorithm.
They are available for all stations providing the EARS-IASI Level 1 service. The timeliness is expected to be better than 30 minutes for 95% of the data, except for the Canadian stations and Fast Dump Extract System (FDES). Figure 7 shows an example of relative humidity fields generated from EARS-IASI L2 over Italy on 13 May 2017.

